Australian shares rallied again in June, capping a better than average year. The recovery from the sell-off in the fourth quarter of 2018 was spectacular. We got a capital gain of 21% in the period from the December 21 lows, plus a sack full of dividends from companies distributing franking credits ahead of the Labor proposal to end refunds.
Global shares also did well, slightly pipping the Australian shares over 12 months with an 11.94% total return.
Adding fuel to the share market return was an about face by the US Federal Reserve, which was threatening tighter rates for most of 2018, followed by what is termed a ‘dovish pivot’ in early January (for non Fed-watchers, the Federal Reserve is said to be ‘dovish’ when rates are being lowered, and ‘hawkish’ when rates are rising. It can also refer to the general mood or bias of the majority of members of the board).
The biggest winner out of the Federal Reserve and the Australian RBA easing bias was the Australian Real-Estate Investment Trust market, also referred to as A-REIT’s. These had a total return of 19.32% during the 2019 financial year.
| INDEX RETURNS AS AT 30 June 2019 (%) | ||||
| 1 month | 3 months | 6 months | One year | |
| Australian Shares | 3.70 | 7.97 | 19.73 | 11.55 |
| International Shares | 5.27 | 5.00 | 16.91 | 11.94 |
| Australian Listed Property | 4.22 | 4.07 | 19.42 | 19.32 |
| Global Listed Property | 0.48 | -0.06 | 13.99 | 7.70 |
| Australian Fixed Interest | 1.04 | 3.05 | 6.59 | 9.57 |
| International Fixed Int | 1.29 | 2.68 | 5.55 | 7.32 |
| Cash | 0.13 | 0.45 | 0.97 | 1.97 |
| Market Indices | ||||
| S&P/ASX 200 Accumulation Index | ||||
| MSCI AC World ex Aust TR Index $A | ||||
| S&P/ASX 300 Property Trusts Accum Index | ||||
| FTSE EPRA/NAREIT DEVELOP NR INDEX (A$ HEDGED) | ||||
| Bloomberg Composite 0 + Years | ||||
| BarCap Global Aggregate Index Hedged AUD | ||||
| Bloomberg Aus Bank Bill Index | ||||
You could be forgiven for saying ‘that A-REIT return looks different from the ‘property price’ returns that I’ve been seeing’! That is because the residential housing market is quite different from the market for large trusts that own commercial, industrial and retail property.
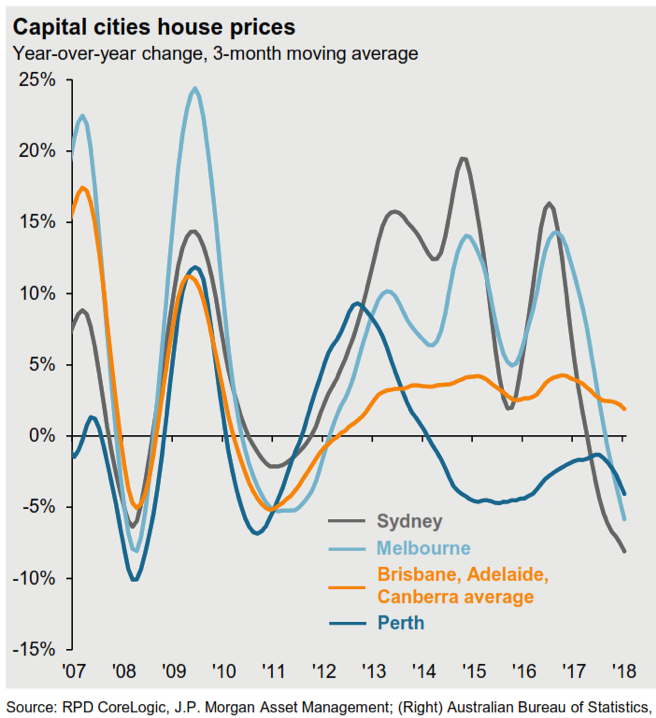
In Chart 1, we show the rate of change in capital city housing prices.
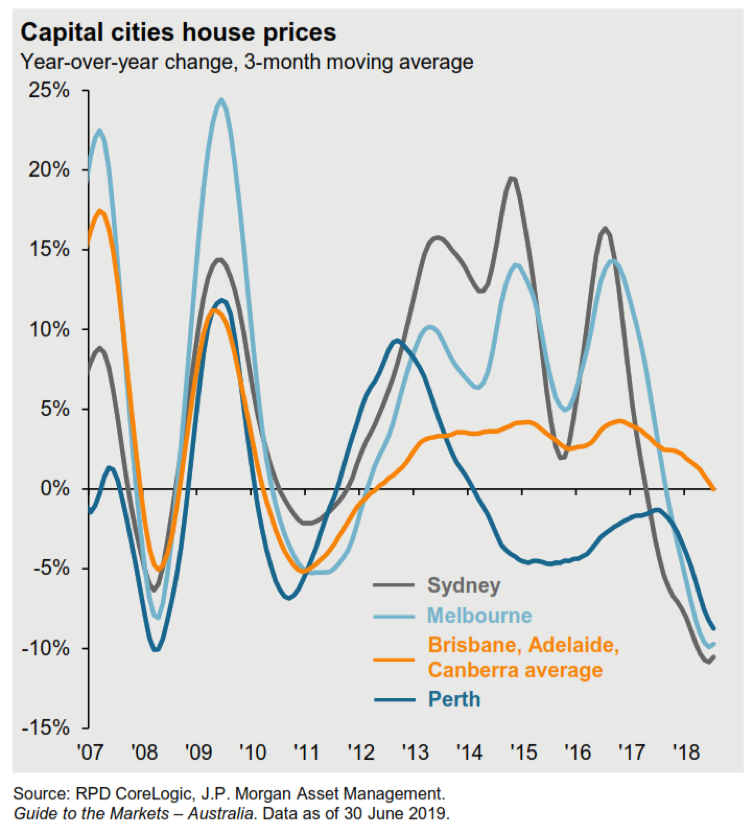
Chart 1: Source, JP Morgan
Next, we have a chart of the capital gains of A-REIT’s over the last two years.
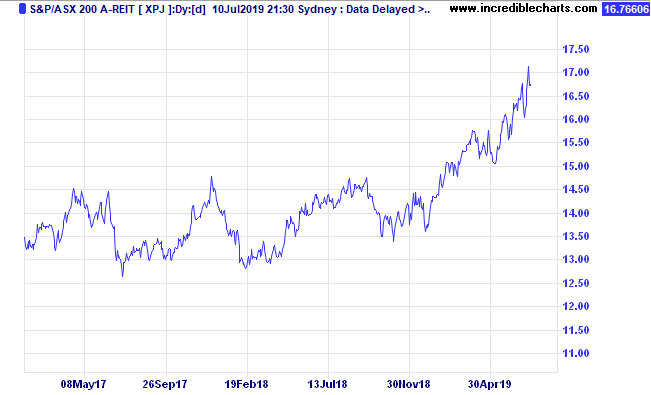
Chart 2: Source, Incredible Charts
The A-REITs were already anticipating higher interest rates in 2016 and had a 17% sell-off between August 2016 and early February 2018. Since then, this interest rate sensitive sector has been a spectacular performer as markets have come to a new realisation that interest rates are not going up any time soon, and the attraction of passive commercial rents (that have been rising, thanks to supply shortages) grows ever stronger.
Residential property on the other hand is far more subject to the supply of new capital to push prices higher. There is not a lot of institutional money invested into residential property (unlike A-REIT’s which are now being driven strongly by passive flows into Exchange Traded Funds), rather, the real driver is credit creation.
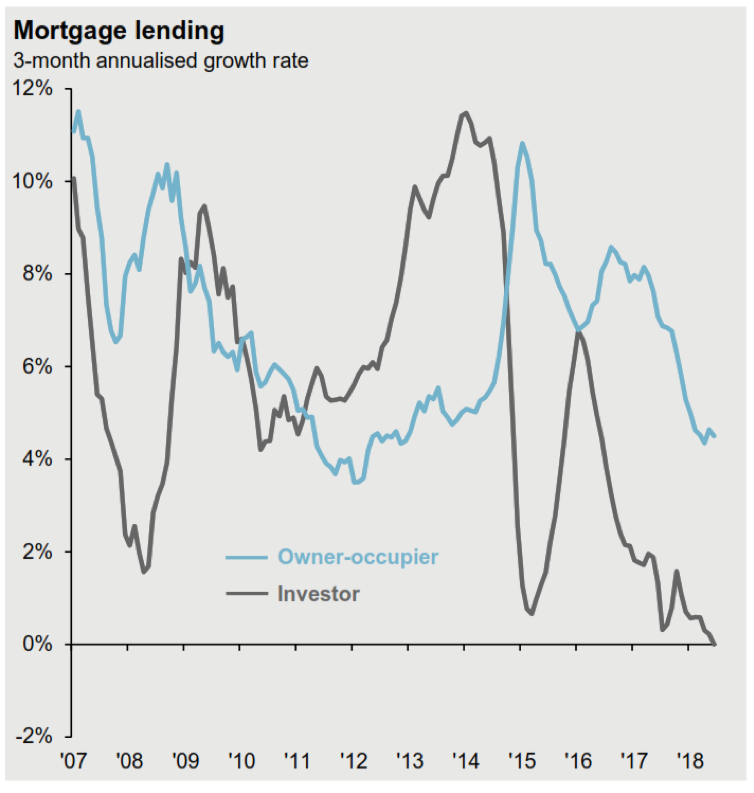
Chart 3: Source, JP Morgan, ABS
You can see in Chart 3 above, that this current credit contraction is deeper than even the GFC when investor lending only fell to slightly under 2% growth rate year on year. We are now sitting at 0% growth in investor lending.
If you are wondering how much effect lending growth rates have on house prices, Chart 4 has the story.

Chart 4: Source, JP Morgan, ABS, RPD Core Logic
Without growth in lending, house prices will stagnate at best. So, to get a handle on where residential house prices are going, watch the housing finance commitments closely.
This is not a signal to rush into the A-REIT market. In fact, there we see signs of froth and bubbles, and need to be cautious. Developers and companies that have been reaping performance fees now dominate the index, and those profits may not be sustainable if this slowdown in global economies is made worse by the current trade tensions.
Receive peace of mind in your personal finance – call Quill Group today
If you want to get more involved with your superannuation, investments or insurance, please give us a call at Quill Group.
For the may market, Australian shares received a strong leg up following the unexpected Coalition win in the May election. The jump in bank stocks when markets opened on the Monday, as well as continued strong commodities prices helped the S&P ASX200 index gain during the month, versus a 4.49% decline in global shares.
The increasing prospect of a new Cold War, fought in the ‘intellectual property’ arena weighed heavily on global shares. Apple was down 12.75%, and Caterpillar was down 14.06%. Contrast that to Australia, where Commonwealth Bank was up 5.35% and Telstra was up 7.98%.
| INDEX RETURNS AS AT 30 April 2019 (%) | ||||
| 1 month | 3 months | 6 months | One year | |
| Australian Shares | 1.71 | 4.88 | 15.32 | 11.08 |
| International Shares | -4.49 | 1.23 | 7.03 | 8.30 |
| Domestic Listed Property | 2.47 | 6.06 | 16.52 | 17.00 |
| Global Listed Property | -0.26 | 2.39 | 6.17 | 8.97 |
| Australian Fixed Interest | 1.70 | 3.85 | 7.08 | 8.96 |
| International Fixed Int | 1.38 | 3.14 | 5.70 | 6.04 |
| Cash | 0.15 | 0.48 | 0.99 | 1.99 |
| Market Indices | ||||
| S&P/ASX 200 Accumulation Index | ||||
| MSCI World ex Aust TR Index $A | ||||
| S&P/ASX 300 Property Trusts Accum Index | ||||
| FTSE EPRA/NAREIT DEVELOP NR INDEX (A$ HEDGED) | ||||
| Bloomberg Composite 0 + Years | ||||
| BarCap Global Aggregate Index Hedged AUD | ||||
| Bloomberg Aus Bank Bill Index | ||||
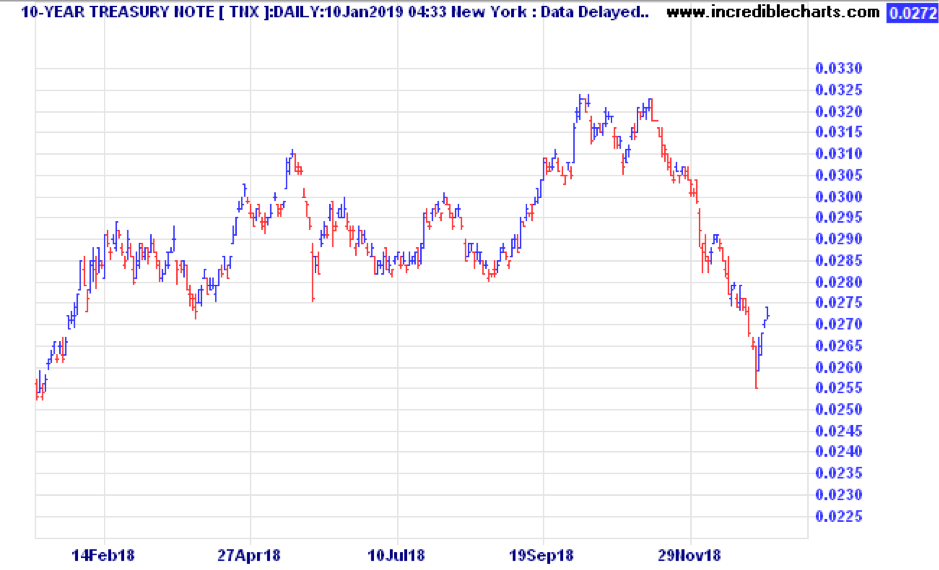
One of the driving forces in this whole rally since the lows in late December 2018 has been the easing of any threat of interest rate rises. The pivot to lower rates accelerated in May, as can be seen in the chart below of ten year bond yields in Australia. The yield to maturity has fallen from a band ranging from 2.6% to 2.9% during most of 2018, to be 1.50% at the end of May. That is right in line with the RBA Official Cash Rate as at that date.
The impact of this cannot be underestimated, and leads most commentators to the conclusion that June is a certainty for a rate cut from 1.50% to 1.25%.
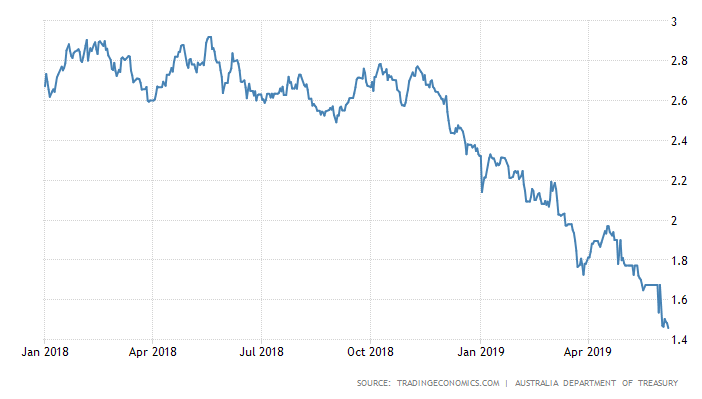
Chart 1. Australian ten year government bond yield.
These lower ‘risk free’ rates of return force investors to rethink their assessment of the current value of future income streams. Or in more plain English, the price people are willing to pay for shares goes up as the price (cost) of money comes down.
Of course, the reason for lower interest rates should also be a factor in the thinking of a rational investor. Rates are lower on account of a number of factors, including trade war risks, inflation that is stubbornly below central bank targets, indications of slowing global growth, high under-employment rates.
Those risks should in the months ahead feed into wider dispersion in individual stock returns. Sectors that are defensive, such as infrastructure and utilities ought to do well if we get widespread belief that rates will be lower for that much longer. That Telstra has been doing so well lately speaks to the fact that essential infrastructure has a high value in a low interest rate world.
One thing we need to watch closely as a barometer of economic conditions is the spread between the most secure government debt and the lowest investment grade, BBB rated debt. Up till the end of April, US markets had been cheering the falling interest rates with rising stock prices. This coincided with the yield difference between US Treasuries (government bonds) and the BBB rated universe of corporate bonds (the credit spread) narrowing from 2.06% on January 3, to 1.48% on April 28. During the month of May, credit spreads widened from 1.48% to 1.71% indicating fears that conditions are deteriorating for corporate bonds. Sooner or later we will see if the risks to the economy are being read correctly by either the bond market or the stock market. Stay tuned!
If you want to get more involved with your superannuation, investments or insurance, please give us a call at Quill Group.
Plunging share prices during December saw everyone fretting on ‘the Santa’ rally – December is often a very strong market. Turns out that Christmas eve was the turning point. I don’t believe in Santa, but I do believe that when markets get deeply oversold, they become ripe for a strong bounce. That is what we got in the last four trading days of December, with the S&P500 up by 6.5%.
An un-precedented event in the last ten years
In a note I sent to clients on December 24, I explained that we had just had 9 down days in a row on the S&P 500 index and that was un-precedented in the last ten years. Some other research in that report (where market is down 3 weeks in a row and the final week is -7% or more) showed that the average return in the week after such extreme events, was 5.87%.
Still, even with the rally, the overall S&P500 return for December was -9.07% and the full 2018 calendar year was -4.94%.
The Morgan Stanley Capital Index (MSCI) of global stock markets in local currencies was -7.69%, though when translated into Australian dollars was a small gain of 1.25% as shown in our table. The Australian dollar decline in 2018 was -9.73% vs the USD, and -5.52% vs the Euro.
| INDEX RETURNS AS AT 31 December 2018 (%) | ||||
| 1 month | 3 months | 6 months | One year | |
| Australian Shares | -0.12 | -8.24 | -6.83 | -2.84 |
| International Shares | -3.62 | -10.29 | -4.25 | 1.25 |
| Domestic Listed Property | 1.73 | -1.71 | 0.24 | 3.27 |
| Global Listed Property | -6.03 | -5.76 | -5.48 | -3.95 |
| Australian Fixed Interest | 1.50 | 2.24 | 2.80 | 4.54 |
| International Fixed Int | 1.43 | 1.66 | 1.59 | 1.65 |
| Cash | 0.15 | 0.48 | 0.99 | 1.92 |
| Market Indices | ||||
| S&P/ASX 200 Accumulation Index | ||||
| MSCI World ex Aust TR Index $A | ||||
| S&P/ASX 300 Property Trusts Accum Index | ||||
| FTSE EPRA/NAREIT DEVELOP NR INDEX (A$ HEDGED) | ||||
| Bloomberg Composite 0 + Years | ||||
| BarCap Global Aggregate Index Hedged AUD | ||||
| Bloomberg Aus Bank Bill Index | ||||
Before we go into the 2019 outlook, it is worthwhile recounting what we said at the start of 2018 (January). “While not suggesting any imminent crash, it is important to understand that outsized gains in widely held asset classes are normally followed by lower than average gains in future”.
Well, 2018 gave us the lower than expected gains, interspersed with two sharp downturns, that are somewhat masked when you only look at the rolling one-year return column.
Outlook for 2019
I have often quoted the Danish proverb, “It is difficult to make predictions, especially about the future”. Yet, each year, we want to rebase our expectations and plan ahead, as if we will somehow be defined by the calendar year. So rather than some kind of arbitrary points-based targets for the various indexes, we consider what is fair value, what is cheap; and what can go well and what could go wrong.
The near 20% decline in the S&P 500 has brought shares back to around fair value on a Price to Earnings (P/E) basis. The big risk is that analysts are too optimistic about earnings, which have so far been pumped up by tax cuts, low interest rates, and a declining rate of un-employment. Earnings can be cut dramatically in a recession.
In Australia the last four brutal months of 2018 has also brought the Australian share market down to a forward P/E ratio of 14.2 which is right in line with the 18 year average. The dividend yield is now 5.1% which is above the 18 year average of 4.6%.
Trouble is, the cheap earnings are in Financials, which are 32% of the ASX200 and have a P/E ratio of 11.7X. The next biggest sector is Materials, where the P/E ratio is 12.8. Stepping outside of those two sectors, which make up 50% of the market, the Industrials are still priced at 20.5 times earnings. Consumer staples are priced at 19.7 times earnings. So while the market looks better value at these levels, one has to be somewhat cautious about the future earnings of banks with the events in property markets in the last year.
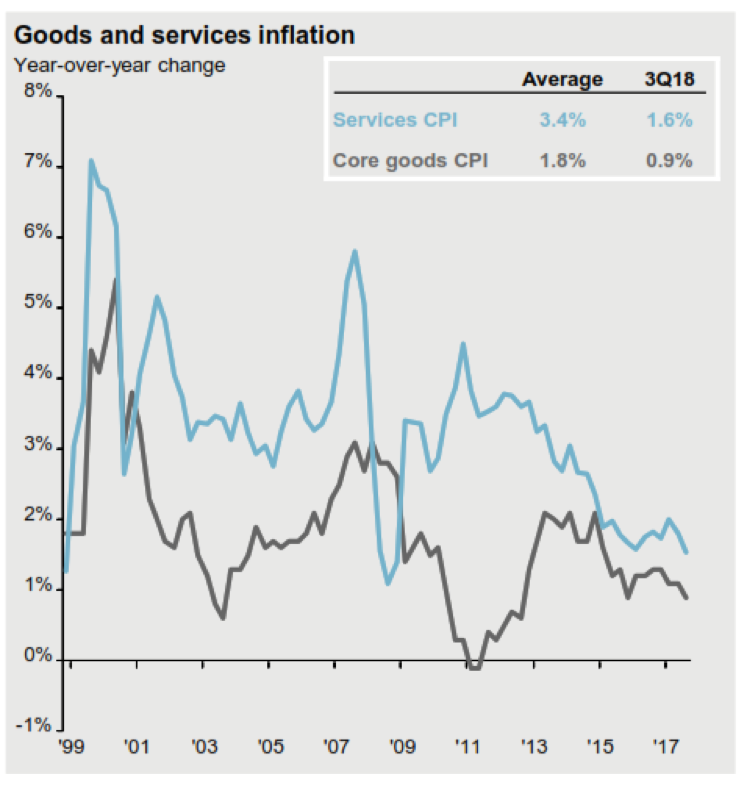
One thing is clear. We have gone from a regime of Inflation and Growth accelerating, (as was the case through 2017), into a phase where the rate of change in both Growth and Inflation are decelerating.
The chart below from JP Morgan illustrated how that is the case in Australia, and this is also true for the USA.
The bond market is telling us that this is not just a monthly blip in the numbers, but rather a general weakening in the economy. After grinding higher with a few pull-backs during the year, the ten year bond yield in America peaked at 3.23% in October, and fell to 2.68% by the end of the year.
The ten-year bond yield is important, as almost all analytical models rely on the expected risk free rate of return (the government bond yield) as a key input to valuing the future cashflows from assets, be they shares, property, or infrastructure assets.
Last year resulted in poor returns for Infrastructure because of the fear of rising rates. We believe that Infrastructure is an asset to consider in 2019, as a reliable source of cashflow, not tied to banking or discretionary spending.
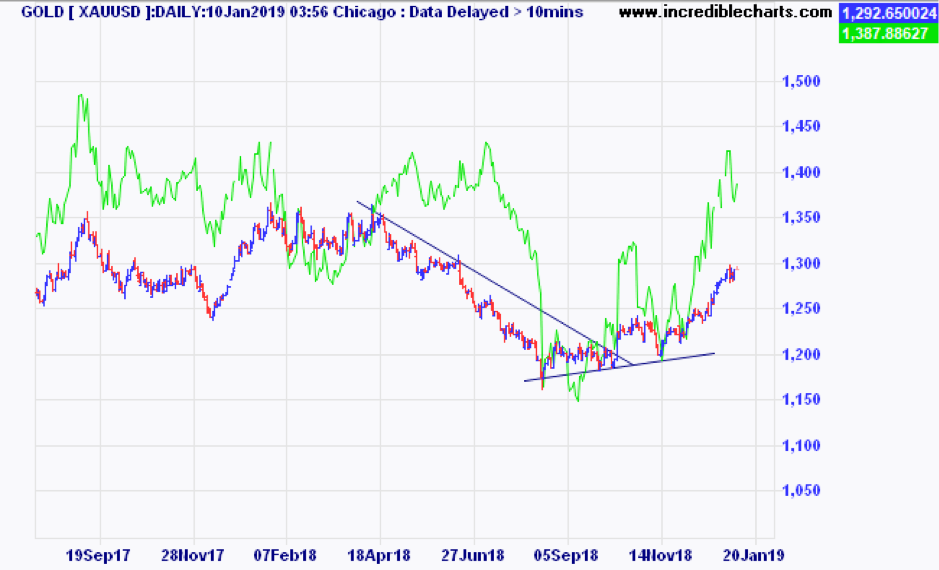
Gold may also do well if political uncertainty continues. Gold was in a downtrend for most of 2018, because a rising USD (happening due to rising interest rates) is the most often the natural enemy of gold. But on 16 August, gold bottomed out, and started its current rise. In the chart below we have interposed the global gold miners index ETF (GDX.ASX) over the gold price, and you can see the crescendo of selling that climaxed on 16 August in both physical gold and the gold mining companies and has perked up and is nicely rising while other assets are falling. Russia added at least 264 tonnes of gold to its central bank coffers during 2018 and other CB’s are doing the same.
The only thing working against gold is the possibility of a stronger US dollar. With Europe and Japan still sitting on the lowest interest rates in a lifetime, the short term rates on offer in the US dollar is still relatively attractive and this may keep the currency stronger.
Emerging markets also have a chance of surprising in 2019. It may not be a popular pick as those markets have also sold off because of the rising USD. They are also victims of the Trump trade disputes, and a number of countries and companies have binged on cheap loans. But within those markets are many sound companies and savvy investors are already bargain hunting select stocks within India, China, Taiwan, Korea and Indonesia.
What is not likely to improve in 2019 is residential property in Australia. The property cycle peaked in mid 2017, and so has been in decline ever since. Some are saying that 2019 might be a good time to buy, however the length of this downswing is likely to be extended due to a number of factors. First, Sydney and Melbourne prices relative to incomes were way above historical averages. Second, the fall so far has been obvious enough that it has changed the mentality of buyers. While the herd mentality on the way up was “FOMO” (fear of missing out), that has now turned to “I can afford to wait”. Third, the credit environment has changed dramatically. The Royal Commission has swung the bankers pendulum to the opposite side, where they are now afraid to write a loan without calculating every single expense, including your Foxtel subscriptions. The fourth factor is that the cash rich, price insensitive Chinese buyers have all but disappeared, thanks to a corruption crackdown, capital restrictions, and changes to stamp duty and land tax for foreign owners.
My view is that we don’t see a bottom in the Sydney and Melbourne markets until 2020 or 2021. Buying at ‘mortgagee in possession’ sales is likely to produce the best bargains.
Conclusions
If this is a normal year, then stocks could do well after the repricing during the September – December sell-off. (We are off to a good start in January) The risk is that companies start to downgrade earnings, (like Apple did recently) and then they don’t look so cheap. Sentiment can turn quickly. Sticking with a well diversified, quality portfolio will pay off in the long run, in spite of short term volatility.
If you want to get more involved with your superannuation, investments or insurance, please give us a call at Quill Group.
First September, then October, and now November – that’s three down months in a row, and so far December is not shaping up to be any better!
To illustrate just how tough the 2018 year has been, we include below a chart from Ned Davis Research twitter feed, showing the number of asset classes with returns above 5% for the year to date (left hand axis – zero), and the percentage of asset classes that did better than 5% on the right hand side – again, the number is a big fat zero. That is quite a feat. Even in 2008 there were two asset classes, The Barclays Treasury index, and the U.S. Aggregate total return bond index that did better than 5%.
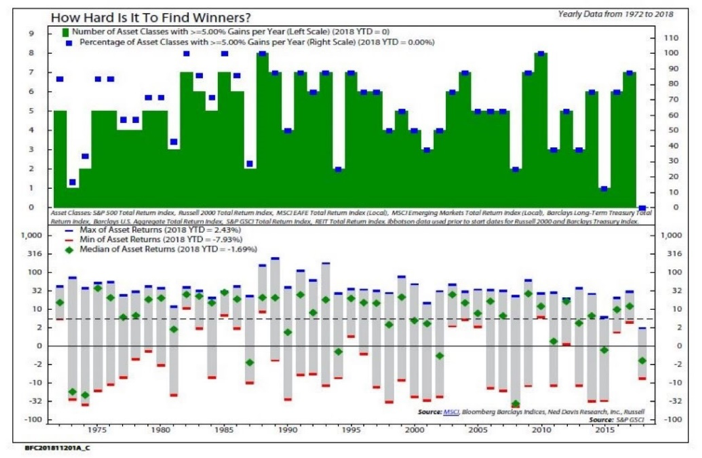
While the chart above is not comprehensive of all assets, Australian investors high exposure to residential property was also likely to have resulted in returns of less than 5% – in some cases a LOT less than 5%.
Why have returns been so poor?
Quite simply, asset prices started the year quite elevated, and in many cases, (corporate and government bonds) pushed up by Central Banks creating an artificially low interest rate environment.
Now that the central banks are trying gradually to exit these positions where they own trillions of dollars of bonds, (and in the case of the Swiss and Japanese central banks – shares as well) it is adding to the oversupply of bonds. When supply exceeds demand then prices either stop going up, or start to fall.
| INDEX RETURNS AS AT 30 November 2018 (%) | ||||
| 1 month | 3 months | 6 months | One year | |
| Australian Shares | -2.21 | -9.28 | -3.67 | -0.96 |
| International Shares | -1.46 | -6.48 | 1.19 | 3.57 |
| Domestic Listed Property | -0.44 | -5.25 | 0.41 | 1.45 |
| Global Listed Property | 3.21 | -1.64 | 3.79 | 3.71 |
| Australian Fixed Interest | 0.24 | 0.30 | 1.76 | 2.45 |
| International Fixed Interest | 0.45 | -0.16 | 0.32 | 0.45 |
| Cash | 0.15 | 0.48 | 0.99 | 1.91 |
| Market Indices | ||||
| S&P/ASX 200 Accumulation Index | ||||
| MSCI World ex Aust TR Index $A | ||||
| S&P/ASX 300 Property Trusts Accum Index | ||||
| FTSE EPRA/NAREIT DEVELOP NR INDEX (A$ HEDGED) | ||||
| Bloomberg Composite 0 + Years | ||||
| BarCap Global Aggregate Index Hedged AUD | ||||
| Bloomberg Aus Bank Bill Index | ||||
Is this a signal that we should be battening down the hatches? There is certainly no shortage of things to worry about.
- Slowing US growth
- Falling oil prices
- Trade wars
- China slowing
- $1 trillion per annum US budget deficits
- Quantitative Tapering (central banks ceasing bond purchases and unloading)
- Central banks being stuck at near zero interest rates, with traditional recession fighting ammunition depleted
- European banks in a fragile state
- Sydney and Melbourne housing finally rolling over
The problem is, that if you know this, and I know this, and the rest of the world knows this, then the whole range of probabilities are already factored into current asset prices.
It is in the gloomiest of circumstances that market bottoms arrive.
What is smart is to avoid investments that can go to zero. That might seem obvious, but to channel the Oracle of Omaha, we cannot avoid market volatility and surprises, but we can try to avoid assets that can bring us a permanent loss of capital. Those assets would be speculative, like crypto currencies that have no established tangible value. Highly leveraged companies, these can be forced into dilutive capital raisings, or if capital is unavailable, simply be bankrupted. Companies with a flawed business model. We saw many examples in 2008 of financial companies that didn’t survive.
Companies with modest borrowings and good business models will survive, and in many cases thrive at the end of any recession as weaker competitors collapse.
The key to successfully riding out volatility is not to become a forced seller. This can happen when you are living on your capital and are overcommitted to shares or property. Try to make sure that you either have so much in shares that the dividends more than cover the income you need, or else hold five years of income needs in cash and high grade fixed interest.
Learn more about understanding market volatility here.
If you want to get more involved with your superannuation, investments or insurance, please give us a call at Quill Group.
For the second time this year, sharemarkets are making major headlines for all the wrong reasons.
There is never any news coverage that tells you stocks are getting expensive.The only time that you hear about sharemarkets in popular news channels is when there have been some sizeable falls by which time it is usually too late to do anything.
From Wednesday October 3rd, through Thursday October 11th, the US sharemarket as measured by the S&P500 Index fell by 6.9%. Over the same period the Australian market fell by 3.9%.
While the magnitude of the declines is nothing special, the speed of these falls was unusual. It was reminiscent of the falls back in February, which were also triggered by fears that interest rates in the US were going up faster than expected. The trigger then was a much better than expected jobs report card.
While the falls have generated plenty of headlines the fact is that no-one knows what next week will bring. We do know, and we have taken a view when setting asset allocations that equities are getting into the expensive territory, and also that this economic expansion is getting long in the tooth. Both of these factors make us inclined to have lower than normal allocations to sharemarkets.
However, even though markets have fallen suddenly, that doesn’t mean they will continue to fall, and in all probability, a bounce higher is more and more probably each day.
Many of you may have heard Warren Buffett’s folksy saying:
‘whether it’s socks or stocks, the Buffett family loves to go shopping when things are on sale’.
Of course the question that we all want to know is, will this be a 5% off sale, or a 50% off sale?
Reverting to history, it is worth re-visiting the chart below, thanks to JP Morgan, that shows how often Australian stocks go on sale, and how much ‘discount’ we can expect.
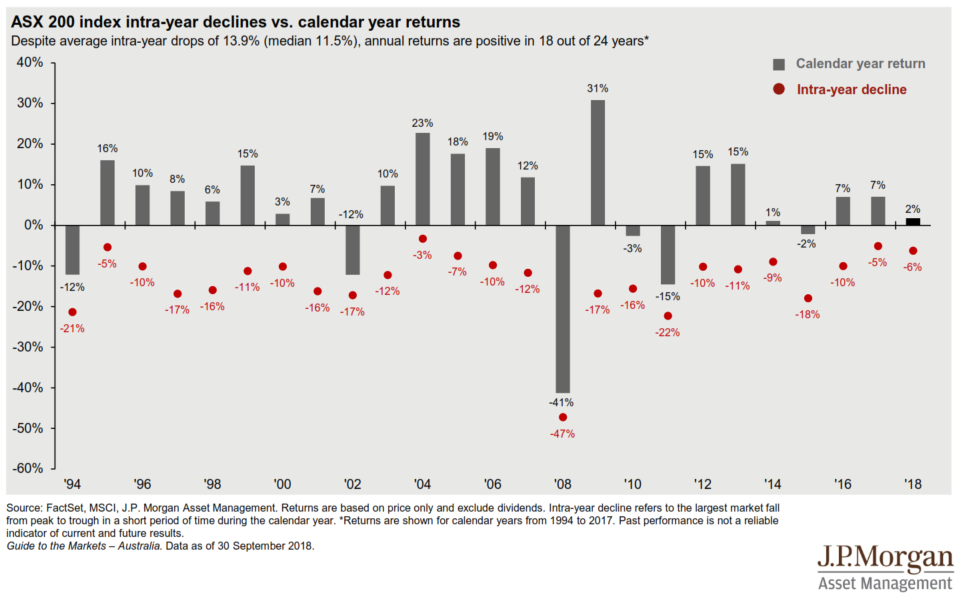
Note that the average sell-off is 13.9% at some point during a financial year. Only in five of the last 24 years has the decline in markets been less than 10% at some point during the year. That means the odds of a fall of 10% or more during any given calendar year are 80%.
Therefore, if this is a normal year, (and we are overdue for a 10% decline) there is probably more downside to come at some point.
At the 5883 points mark (ASX/S&P200) from last Thursday (11 October) we are down 7.38% from the 6352 high that we made on August 29th.
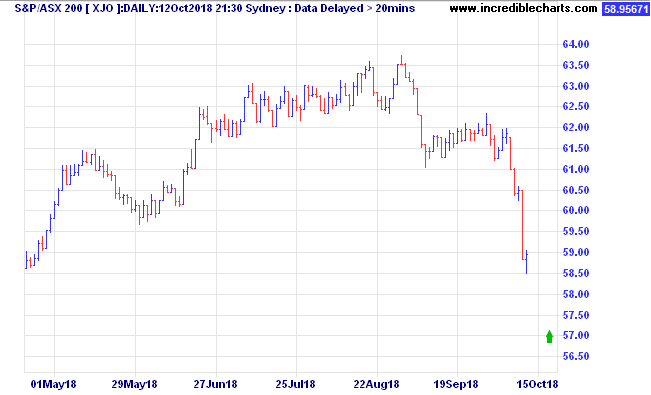
To make the typical 10% sell-off we would need to see the ASX/S&P200 down another 2.8% downside to 5,716 points. If this is a typical ‘correction’ that would be your buying point.
Of course, there is a risk that the sell-off may go much deeper.
In the US, this is now the longest ‘bull run’ in history. The market has been rising for 114 months without a bear market (fall of more than 20%). The longest prior bull market was 113 months from October 1990 to March 2000. One fund manager who is represented in many of our portfolios believes there is a 50% probability on a fall in US markets of between 20% to 30%.
We take the view that unless you can commit to holding shares for at least five years then you ought not be in that asset class at all. Discuss this with your adviser if you are not sure that you are positioned correctly.
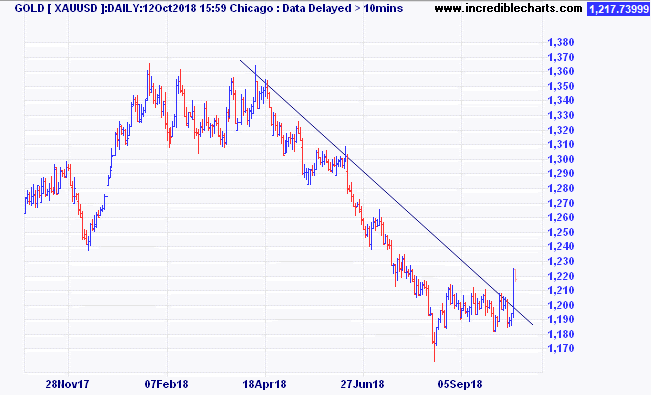
Another little fact that may be useful (and has not been mentioned in the media) is that during the last four US bear markets, (falls of more than 20%) the one asset that has done well every time was gold. It is also relevant that gold has just last week broken up through a six-month downtrend line. Normally a strong US dollar is bad for gold and that has been a drag on the performance of gold while stocks were doing well. But gold, along with the US dollar is also seen as a safe haven in times of stress in other assets and they may just start to rise in unison.
As an antidote to expensive sharemarkets, the Quill Group Investment Committee has recommended Equity Market Neutral funds and Hedge Fund exposures in our portfolios. We believe that although they have not performed as well as shares during the bull market, they will provide meaningful diversification in the event of further downside.
No one has the ability to accurately predict tops or bottoms in the market. Never act in haste. Today’s news is tomorrows fish and chips wrapper. Always discuss your feelings and fears with an adviser to ensure that your strategy is right for your circumstances.

Contact Quill Group today
Get in contact with Quill Group today to discover how we can help you navigate through your finances. At Quill, we are passionate advocates for all of our clients and our team is focussed on providing an experience, not just great service. As the largest multi-disciplined financial services practice on the Gold Coast we provide a high touch personalised service delivered with competence, confidence and amazing results.
The S&P/ASX 200 Accumulation Index reached a new post GFC peak in the final days of August, at 6352. (The pre-GFC high was 6828 on 1 November). During September the index fell for the first five trading days, and then managed to rally to a close for the month that was only down 1.26%. Since then markets have come under heavy selling. Later we also take a look at the FANG stocks update – Facebook, Amazon, Netflix and Google.
International share markets were mixed, but showed a 0.55% gain after adjusting for the lower Australian dollar.
The Australian Real Estate Investment Trust (A-REIT) sector fell through September on fears of higher interest rates taking a bite out of earnings and distributions. We have been avoiding Global Listed Property for some time, with the outlook on US rates rising more rapidly than Australia, and hence more downside in those markets. The results in September backed up that view.
| INDEX RETURNS AS AT 30 September 2018 (%) | ||||
| 1 month | 3 months | 6 months | One year | |
| Australian Shares | -1.26 | 1.53 | 10.13 | 13.97 |
| International Shares | 0.55 | 7.32 | 13.57 | 21.29 |
| Domestic Listed Property | -1.55 | 1.98 | 12.00 | 13.25 |
| Global Listed Property | -1.84 | 0.30 | 7.63 | 5.63 |
| Australian Fixed Interest | -0.42 | 0.54 | 1.36 | 3.72 |
| International Fixed Int | -0.38 | -0.07 | 0.08 | 0.89 |
| Cash | 0.16 | 0.52 | 1.01 | 1.87 |
| Market Indices | ||||
| S&P/ASX 200 Accumulation Index | ||||
| MSCI World ex Aust TR Index $A | ||||
| S&P/ASX 300 Property Trusts Accum Index | ||||
| FTSE EPRA/NAREIT DEVELOP NR INDEX (A$ HEDGED) | ||||
| Bloomberg Composite 0 + Years | ||||
| BarCap Global Aggregate Index Hedged AUD | ||||
| Bloomberg Aus Bank Bill Index | ||||
Fixed interest markets also lost money over September, as longer term rates, especially in the USA, continued to rise. Cash is not very attractive, but it is worth noting that it beat the return from Global Fixed interest over the last 12 months. During the month of September, the Australian 10 year government bond yield rose from 2.52% to 2.67%. For reference, over the same period, the US ten year bond yield rose from 2.85% to 3.05%.
Regular readers will know that we have been cautious on sharemarkets and US markets in particular, on the basis that valuations of some of the leading stocks was very stretched, and that any change in sentiment would hit hard. Well, that is what has been happening in the last month or more.
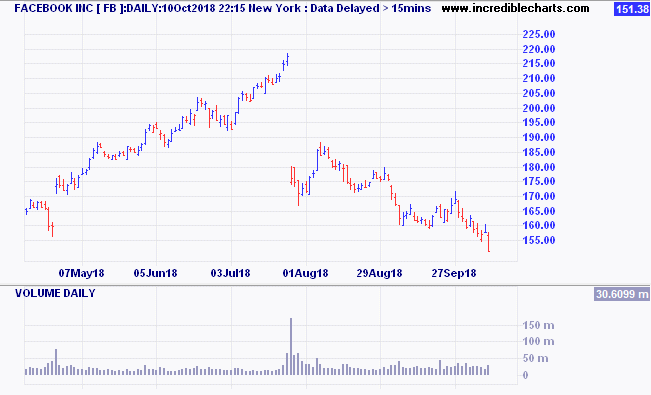
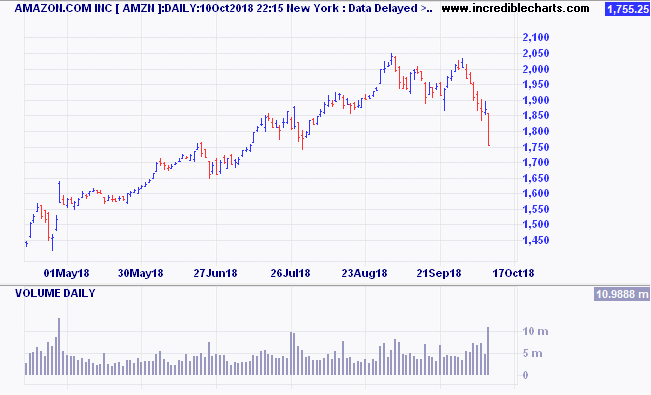
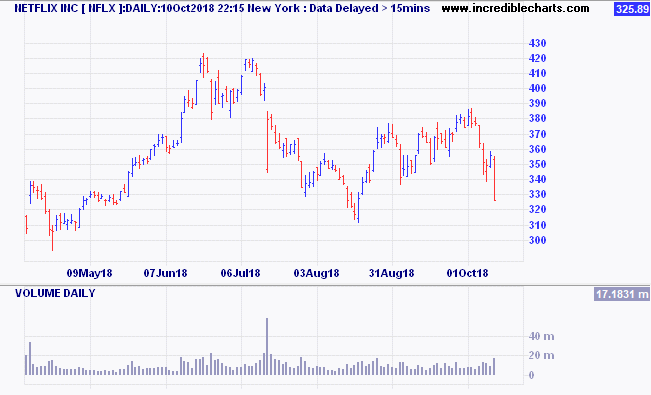
FANG stock update – Facebook, Amazon, Netflix and Google
Here are the charts for Facebook, Amazon, Netflix and Google, the so-called FANG stocks.
Facebook:
Amazon:
Netflix:
Google:
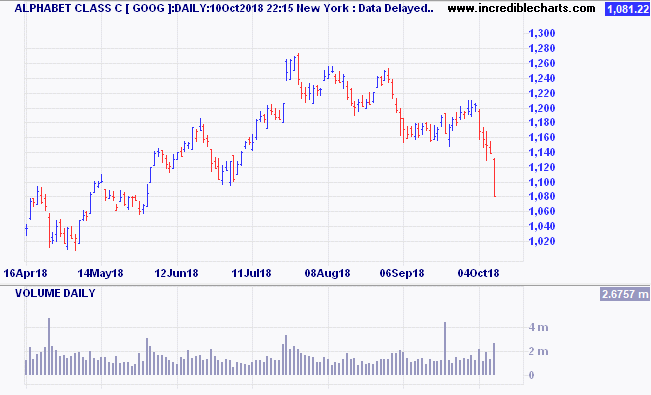
There is no doubt these companies have achieved amazing growth and appear to have dominant market positions, but if you pay too much, then they won’t produce a good investment return. This is the conundrum that faces investment managers every day.
Contact Quill Group today
If you have concerns about your debt, financial structures or superannuation, please give us a call at Quill Group. At Quill, we are passionate advocates for all of our clients and our team is focussed on providing an experience, not just great service. As the largest multi-disciplined financial services practice on the Gold Coast we provide a high touch personalised service delivered with competence, confidence and amazing results.