Quill is a financial services business with a team of passionate professionals who are committed to working with family businesses, working families and retired families.
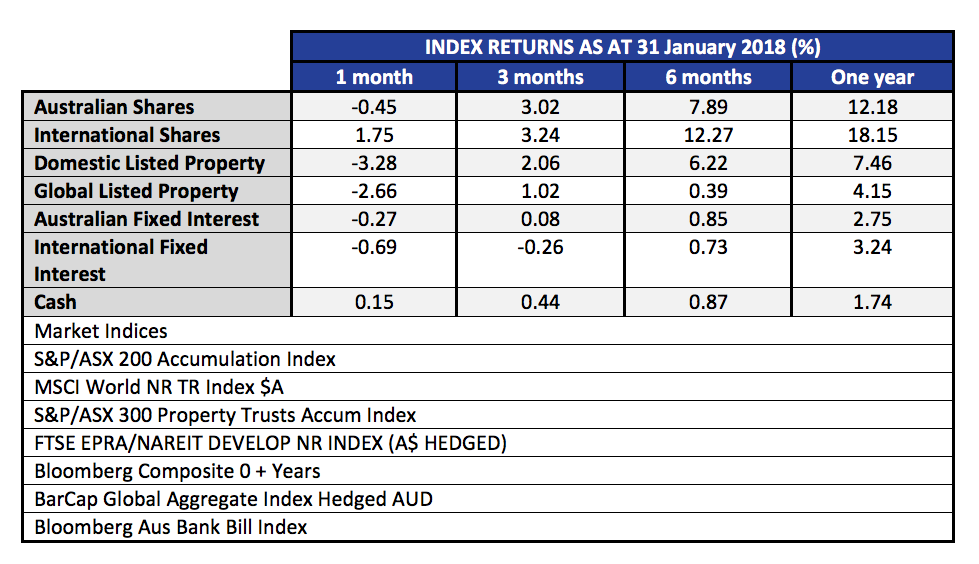
The month of January was relatively benign. Australian shares fell a little, and with the falling Australian dollar, international shares did fairly well for the month. Below we publish the 12 month rolling returns. Listed property, (local and global), was down on the rising interest rate curve.
The real story that everyone wants to know about is, what happened in the first week of February, and what does that say about the rest of this year – and indeed the stock market outlook? First up, it is worth taking a look at the charts to visualise what happened.
In the US market, the best index to watch is the S&P 500 Index.This is a much broader measure of stock prices, covering the 500 largest companies, versus the oft quoted Dow Jones Industrial Average (DJIA) which covers only 30 stocks, and is measured by assuming ownership of one share of each company, adjusted for splits and additions (it’s complicated).
Anyhow, from the high on Friday 26 January, to the intraday low on Friday 9 February, the S&P 500 lost 11.83%. (In the same period the Australian market was -4.36%) A 10% fall qualifies as the first ‘correction’ of the year, and follows a very benign 2017, when the steepest peak to trough loss for US shares was in the order of 3%. In the space of 10 trading days, all of the gains of the last two months were reversed. In that context, it is actually no big deal. Traditionally we expect a peak to trough loss of at least 10% in most years. This year it just happened early, happened fast, and followed a long period of stable markets, where complacency had become widespread. In fact, 2017 was so stable, in Australia we had the lowest number of daily moves of +/- 1.00% since 2004.
The real story behind this decline (aside from the usual finger pointing at algorithms, and portfolio insurance) is the rapid rise in the US long term interest rate curve. Below we show a six month chart of the US ten year bonds yields.
Notice that during January, the US Ten Year bond yields were accelerating up out of the 2.4% to 2.5% range, towards 2.85%. The rot started to set in on Friday 2 Feb, when the yields jumped from 2.78% to 2.85% on the positive US jobs report. Note that important point. Good news is bad news! IE; economy improving, jobs up, but that theoretically brings inflation and wages growth, and higher borrowing costs.
At present, rising bond yields combined with falling stock prices are a double whammy for what was once a staple of investing, the 60/40 portfolio where 60% was in shares, and 40% in bonds. With lifetime low yields we at Quill Group have been positioned to avoid long interest rate duration in the bond (fixed interest) part of our portfolios. While on the topic of bond yields, it is worth taking a look at the last 30 years of US Ten Year bond rates.
Note the clear downtrend channel that we have been in since 1982. (chart data is since 2000, but the peak was in 1982).
It is very important to understand the effect those falling interest rates over 35 years have had on asset prices. Now we appear to be on the cusp of breaking out of that downtrend. As you might well realise, this is potentially a very important juncture in history. It is for this reason that we think that volatility has made a violent return. It’s not every day that 35 year trends reverse! Higher interest rates mean valuation models are readjusted to take into account that the risk free rate of return (generally accepted as the ten year government bond rate of the country of the asset being valued). When the risk free rate is higher, the rate of return required to take equity risk is also higher. If cashflows (profit) cannot also be expected to rise (will the higher interest rates undermine any improvement in top line through an improving economy?) then the current value of those future cashflows gets marked down.
So, what does this ‘correction’ portend? Is it just a ‘cleansing pause’ or the start of a longer term decline? To be honest, no one can know for certain. Yes the talking heads will strongly argue whatever is their view. The vested interests will tell you to stay the course. The conspiracy theorists will say this is the beginning of the end.
What we do know is this. Returns going forward are likely to be lower than in the past. Our outlook for benchmark equity indices over the five to ten year horizon is well short of double digits. To get a double digit return we believe you will need to employ active management at a stock level, and an asset allocation level – which is something we seek from our investment partners.
So, what is the most likely outcome? As mentioned, valuations are elevated compared to history. However, we don’t see enough pent up demand from consumers or tight enough labour conditions to see inflation becoming a real problem yet.
Bear markets, which are defined as a market decline of 20% or more, are normally accompanied by a recession.
In that respect, global growth is on track to be more synchronised this year than in any of the last 36 years. In the US, they are looking forward to lower corporate taxes, and the spending on wages and investment which should follow. Indexes of purchasing managers intentions in all the major regions are nowhere like indicating any sort of slowdown in the economy.
The yield curve is also an early warning signal of a recession. Leading into the last seven recessions in the USA, the ten year bond yield has dropped below the two year bond yield every time.
Today the bond yield is certainly flatter – but is not yet near an inversion. The current US two year bond yield is 2.07%, and the ten year is 2.85%.
The chart below from JP Morgan illustrates the ‘gap’. If history is still a guide to the future (and granted, it may not be) the peak in this bull market may still be more than a year away.
The same source, (JP Morgan) also points out that the average time from ‘yield curve inversion’ to stock market peak is 10 months. The shortest period was 3 months (in 1980) and the longest was 19 months (in 1988).
In the USA, over the last 90 years, there have been 10 bear markets (falls of greater than 20%). Eight of those were accompanied by recessions. Only the ‘flash crash’ at the time of the Cuban Missile crisis in December 1961, and the famous ’87 crash had no ‘recession’ trigger. Although painful, (1962; -28%, 1987; -34%) they were short, both over within 6 months.
Given the history, and that we see no recession triggers on the horizon at present, we believe the market will find a bottom sometime in the next month or two, and then continue to grind higher over the course of the year.
However, it is also impossible to completely discount the risk of a deeper flash crash, especially with central banks looking to end their massive liquidity injections.
As a result we caution against being too aggressive on buying the dips, and also warn against over-leverage in these conditions. A portfolio with well thought out diversification across the major asset classes as well as alternatives, will still deliver the best results in the medium to long term.
It is one of the most important principles of investing and the chances are, you have heard it before “ensure you build a diversified portfolio” or “don’t put all your eggs in one basket”. However, most novice investors don’t really understand why diversification is so important to their investment strategy.
Here, we’ll take you through the fundamentals of diversification and a little look into the value it provides.
Firstly, how does diversification work?
Having a diversified portfolio doesn’t mean you are guaranteed to be protected against losses or guaranteed to have gains. It simply means you have a strategy in place to effectively manage the risk and reward trade off to help you achieve consistency in your returns over time.
For many reasons, the markets for different asset classes peak at different times and they don’t particularly move in exactly the same way. Different asset classes react differently to what’s happening in the economy and world around us. While one market can experience a surge, another can be on a downhill run.
To manage this risk, financial experts believe you should spread your funds across several markets. This may potentially offset any losses from a market downturn in one asset, by gains from another market that is performing better at that time. Spreading your funds across a number of different investment types means you will be well diversified and have limited your exposure to any single asset. In turn, your overall returns will be less volatile.
What constitutes as a diverse portfolio?
To diversify your portfolio, you need to invest across different asset classes. This should include a mix of growth assets and defensive assets:
Growth Assets
Investments that have a higher risk and reward – include investments that generally provide longer term capital gains such as shares or property.
Defensive Assets
Investments that have a lower risk and reward – include investments such as cash or fixed interest.
More characteristics of a diversified portfolio are:
- Investments are across different asset classes such as cash, property, fixed interest, Australian and international shares.
- Different types of investments are within asset classes. For example, having shares across different industry sectors.
- Investments are across different fund managers. Applicable if investing in managed funds.
EXAMPLE: Diversification inside a particular asset class
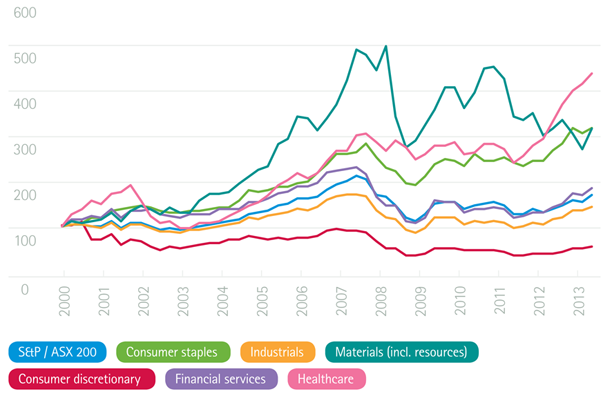
Just to show you as an example, the below graph shows how different sectors of the Australian share market have performed over time. You can see that some sectors are more volatile than others.
Sectors of the Australian Sharemarket
Source: Australian Securities Exchange and Thomson Reuters 2013
The benefits of diversification
There are three main benefits to having a diversified portfolio:
Minimising risk of loss
As explained above, diversified portfolios have less risk than concentrated portfolios. If one investment performs poorly over a certain period, other investments may perform better over that same period. This reduces the potential losses of your investment portfolio.
Generating returns
We all know that sometimes investments don’t perform the way we expected them to. So, by diversifying your portfolio, you’re not merely relying upon one source for income. It also allows you to add riskier types of investments to your portfolio without increasing your overall risk levels.
Preserving capital
Some investors are not in the accumulation phase of life and are closer to retirement. These investors have a different set of investment goals which are oriented towards preservation of capital vs driving returns. Diversification can help protect their savings by reducing the overall risk in their portfolio.
Creating a portfolio for you
As you can see above, diversifying your portfolio can be beneficial but complicated. It depends on a host of factors including your appetite for risk, investment objectives, time frame and available capital. It requires a strong knowledge of the various asset classes, markets and sectors to ensure it is executed effectively.
To get the best results and create a portfolio suited to your particular needs and circumstances, it might be wise to talk to one of our financial planners.
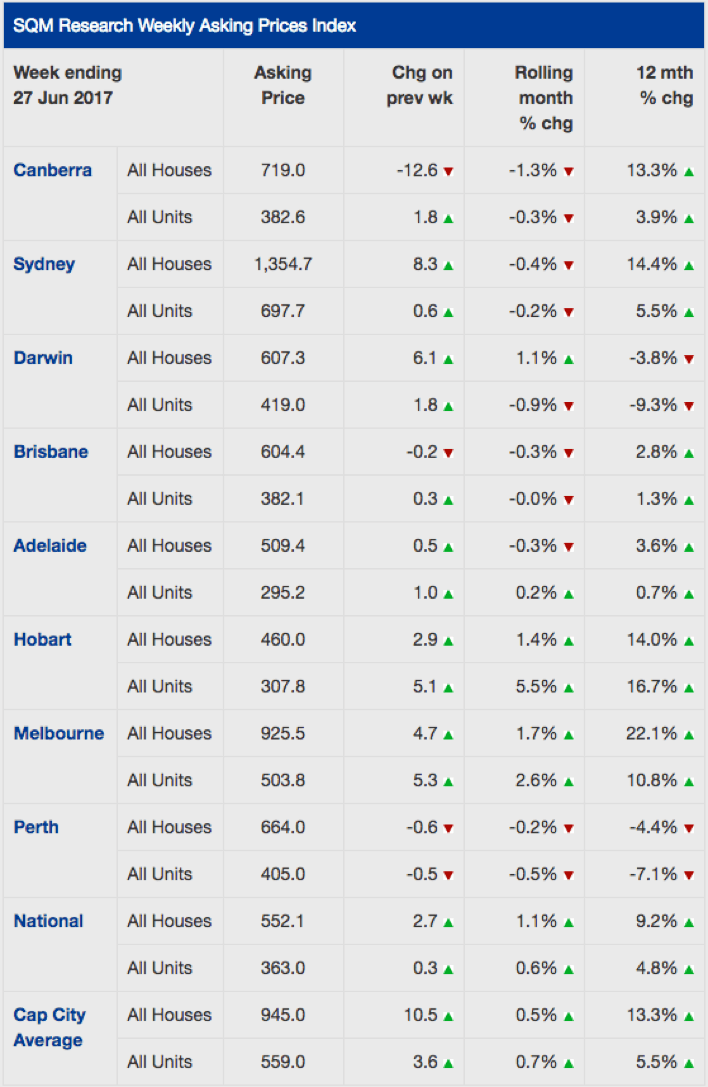
The property market, you will probably know that we don’t often comment on residential property. Due to it being such a heterogeneous asset class (the opposite to homogenous) there are pockets performing differently everywhere. However, given that most of us will have some exposure, we have included some observations from SQM Research to update you on the broader market.
Source: SQM Research
Perth and Darwin prices are the only ones showing year on year falls. We recall only 2 years ago being offered apartments in booming Darwin to ‘sell’ to our clients. Our scepticism and avoidance of conflicts of interest kept us well away from that disaster.
Over the month of June, Sydney prices are showing a small decline, though year on year was strong. Melbourne too was a standout, with even bigger gains than Sydney. Hobart off a low base showed strong gains as well.
While we are not local market experts in each suburb, we do caution that a lot of those rises have come from availability of credit, and ultra-low interest rates. With the APRA edict to limit interest only loans, the banks are taking the opportunity to re-price those loans to a much higher level. If they execute that well, then there will be extra profits for the banks, and not too much pain for residential investors. We hope!
After a big sell-off in May, (-4.01%) the S&P/ASX200 Accumulation index managed a small gain of 0.17% for the month of June.
That was better though than Global markets, where the MSCI World index (in Aust Dollars) lost 2.54% for the month.
Bond markets sold off during June as interest rates rose, and the A-REIT sector (real-estate trusts) also had a fall, losing 4.51% over the month.
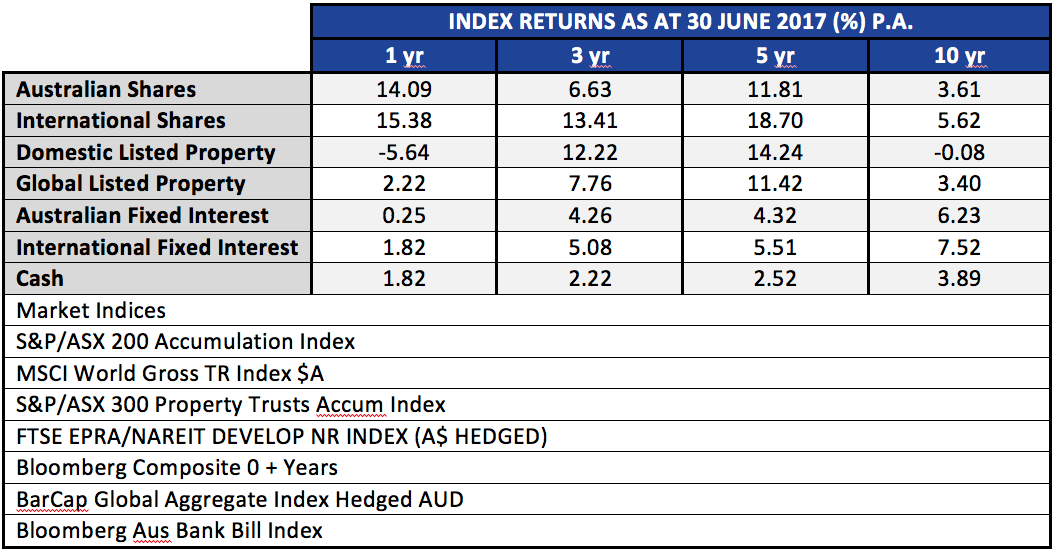
In spite of those falls, stepping back a bit to look at the whole year shows a much brighter picture of returns. The table below looks at the major liquid asset classes over the last ten years.
There are a few notable points here. The one, three and five year returns for Australian and International shares have been very positive overall. Yet, when looking at the 10 year numbers, the returns from those assets are below the Fixed Interest returns. And, when looking at fixed income returns we see that the returns this year have been low, lower in fact than a simple ‘buy term deposits’ strategy. Clearly timing is important, yet we are often told that ‘market timing’ is a fool’s errand. That debate is for another day, but we make the point that a thinking person needs to be able to bring into perspective the nuances of different rolling time frames.
As we now know from history, October/November 2007 was the peak of markets pre GFC. Markets all bottomed in about March 2009. These ten year numbers in the table above look sick now, but 18 months from now, they will start to look fantastic as we roll off the prior periods, and have a starting point that is very favourable.
But we must beware of extrapolating with no reasonable basis. Those five year numbers for the shares and property are unlikely to be repeated in the next five years. The temptation for in-experienced investors is to chase last year’s winner. Invariably rotation happens within markets.
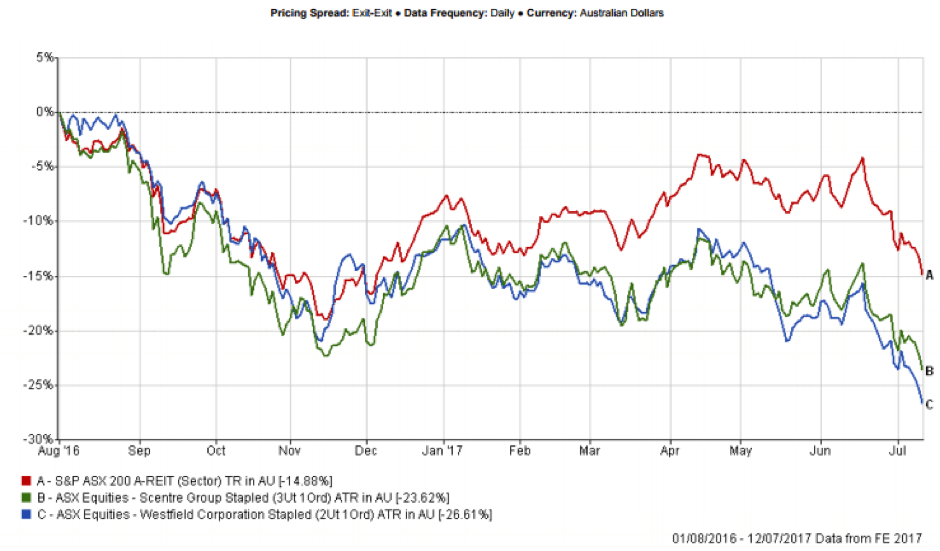
What piques our interest is that which is out of favour. And the A-REIT market falls into that camp being 11 months into a correction. Our general view last year was that it was hard to find compelling value in the sector. As a result our exposures have been relatively low. From 1 August to 12 July the A-REIT sector has declined 14.88%. Those kind of moves get us interested. Former market darling Westfield with global assets and Scentre Group holding the Australian Westfield centres, has been taken a big hit, down around 25% since the peak back in August 2016.
Make no mistake, Amazon will not kill the retail mall. And as the saying attributed to various wise men from King Solomon to Abraham Lincoln goes, “This too shall pass”!
Bitcoin, Bitcoin, Bitcoin. The chant grew louder with every passing day!
Anyone who follows me on Twitter @marks_thinking will have seen my occasional tweets on Bitcoin and the closely related crypto currency called Ethereum or Ether. Now call me a dinosaur, but when I was a boy, ether came in a spray can and we used to help start old diesel engines on a cold frosty morning.
OK, so I might not be up with all the latest Bitcoin mining techniques, but I have been around through a few financial bubbles, studied many of the past financial bubbles and given enough advice to know about human nature.
That experience tells me that people are going to get hurt.
Why?
Let’s circle back to what Bitcoin claims to be. It is a crypto currency. Put simply it is another form of payment system, but instead of being able to be converted into secure bank notes, its allure is that it can be transmitted from person to person using a globally distributed ledger. Just as a bank has a ‘ledger’ to track who has cash on deposit and who owes the bank money, this global ledger does the same for Bitcoin. The difference is that no single bank or organisation ‘owns’ the Bitcoin ledger. The ledger is also referred to as a ‘blockchain’ system. The globally distributed ‘ledger’ is what enables anonymity of transactions using Bitcoin.
That last factor makes Bitcoin incredibly useful if you don’t want your transactions traced! Handy if you are dealing in drugs, arms or any other weird stuff that is usually outlawed. Perversely, in spite of toughening identity checks that banks are now required to do, the Federal Government just made it easier to deal in crypto currencies by announcing in the Federal Budget that from July 1, investors buying cryptocurrencies would no longer be paying GST on their initial purchase. Talk about double standards! Sorry, I digress.
So, let’s come back to the principal purpose of any currency. It is a means of exchanging labour for goods and a means of storing past labours for an indefinite time until we want to again convert that labour into current goods. One would assume therefore that there should be a stable relationship between the labour and the currency. Our Australian dollar does that fairly well. If we get $25 for an hour’s work, we know that we can buy five coffees or a kilo of average steak and so on. Of course when our buying power increases we are happy, not so much a decrease.
So how does Bitcoin stack up on terms of stability?
Well, had you taken all your salary as Bitcoin during 2016 you might be pretty happy today.
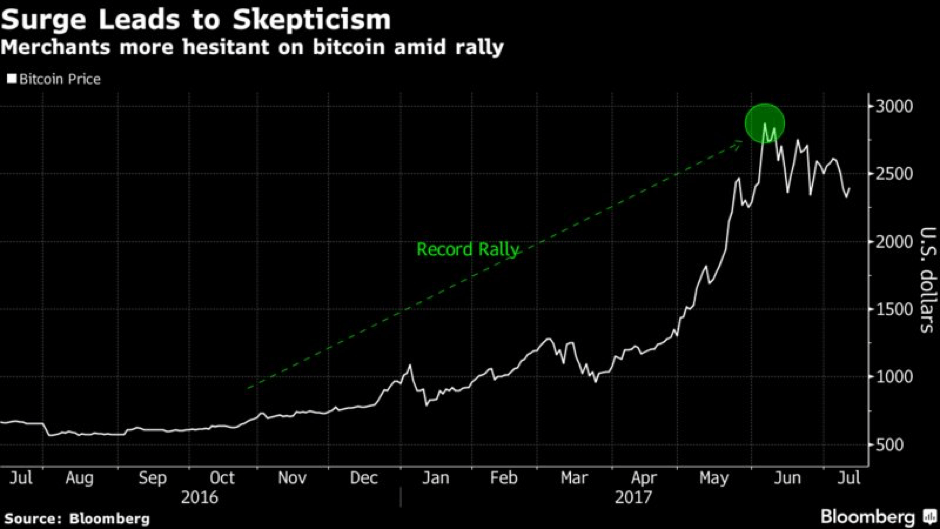
The chart below shows the explosive rise of Bitcoin since then.
Bitcoin’s absolute high (so far) was $3,003 USD per coin, back in early June. However, since then it has declined to $2,516 or a 16.2% decline in about a month. That hardly seems like a stable store of value. Back in 2013/14 Bitcoin halved in value following a series of exchange blow-ups. Again, not a very useful store of value. That could easily happen again!
In addition, the architecture of Bitcoin means it is on a slow road to gradual extinction. With a maximum of 21,000,000 Bitcoins can ever be created thanks to the way it was originally conceived. When that ceiling is met, the only reward to the participants who use huge amounts of computing power to maintain the ledgers will be transaction fees. Sometime before then Bitcoin will go into a death spiral as owners try to exchange into other crypto currencies, or heaven forbid, real assets.
However, with limited supply Bitcoin may still increase in value if the ‘value’ placed on anonymity increases. We cannot know for sure. While I have a healthy mistrust of Central Bankers, and banks in general, I trust them more than I to the shadowy geeks in dark rooms that control today’s crypto currencies.
Apart from speculative value as a trading item, (as you might trade tulip bulbs) I view Bitcoin as the principal currency of those who need their transactions to be absolutely secret and un-traceable.
Having said that, currencies like Bitcoin and Ethereum have contributed greatly to the advancements in using ‘blockchain’ or de-centralised ledgers to track ownership of assets. I think we will see huge changes to banking systems using this technology in coming years.
But for now, I’m old fashioned, drug free, don’t carry no illegal firearms, and I don’t need no crypto-currency.

