The S&P/ASX200 Accumulation index finally put in a surge in October, with a gain of 4.01% in the month, shaking off a 6 month malaise. Twelve month numbers are back up to 16.13% almost double our expected annual 12 month returns of around 8.5%.
Global Markets
Global markets also had a good month, with gains of 4.29% and a rolling 12 month return that tops the charts at 22.53%. Emerging Markets posted even higher returns with a gain of 5.92% in October, and one year returns of 25.49%. Although vulnerable to negative events in the short term, Emerging Markets remain somewhat cheaper than developed markets, with arguably more to gain from structural reforms and demographic changes.
Bond Markets
Bond markets improved in October, posting a gain of 1.09% on average. However one year gains are still muted at 1.64%, held back by long bond yields that are drifting higher, albeit at a slow pace. Our preferred exposures in this sector are high grade corporate debt, with short maturities.
Official Cash Rate
The Official Cash Rate as controlled by the Reserve Bank, and affecting term deposit rates, don’t appear to have much potential at all for increases in the next twelve months. We have some concerns that if US rates do continue higher with the expected 3 or 4 rate rises in 2018, the downward pressure on the AUD will continue, creating some inflation in tradeable goods.
Real Estate Markets
The A-REIT sector (real-estate trusts) saw gains of 2.25% for the month of October. This sector is still feeling the headwinds of potential higher long bond rates, though we think that risk is over-rated presently, and also the onslaught of Amazon which may (or may not) further hollow out the Australian retail sector. Being somewhat contrarian, we feel this sector is shows much better value now than it has for a couple of years. Real estate has many different sub-sectors and geographical differences, so please don’t mistake our view of fair value in parts of the A-REIT sector for any kind of enthusiasm about residential markets. We think it is fair to assume that for the most part the residential sector has peaked.
The Australian market had a fair month in August. Mark takes us through the performance across the board to prepare us for what’s to come.
Stockmarkets
The Australian market had a fair month in August, with the ASX 200 Accumulation Index posting a 0.71% return for the month, which annualises out to around 8.5% which is within a few points of our expected long term returns. The commodities price was the action sector with Energy shares (+6.07%) delivered the biggest gains.
The rolling one year historic returns for the ASX200 Accumulation index is now 9.79%, rolling off some good periods in FY 2017 which saw a great return of 14.09%. Sentiment on Australia remains patchy. Banks, our largest sector have plenty of sceptics due to the high capital city house prices, and highly leveraged consumers. Our other big sector being materials, seems captive to sentiment about what China will do next.
Looking globally, the MSCI World Index gained 0.85% in AUD terms during August, supported by Asian markets which we favour as having the lowest valuations, and most room for improvement thanks to demographics and lower levels of current consumer debt. The rolling one year historic return for the MSCI World in AUD is now 10.71%, while the Emerging Markets gained 18% over the last twelve months.
Property
The S&P/ASX 300 A-REIT Accumulation Index gained 1.51% in August after coming under pressure in July. It has been a relatively good reporting season for listed property. Both of the giant Westfield entities are still under pressure as the market realises that there is a breaking point with retail rents. Add to that the Amazonian threat, and we are seeing the big malls trade closer to fair value.
While listed property prices have come off recently, direct commercial, industrial and retail property sales continue at higher levels. In some sectors it is possible to buy trusts at a discount to the value of their assets when like for like sales of direct assets are compared. In addition those listed trusts give you 3 day liquidity, and no stamp duty.
Residential markets appear to be softening in Sydney, but less so in Melbourne. Asking prices in Sydney fell by 2.5% over the last week, but are still up 12.5% year on year. Listing in Sydney rose 5% over the month of August, and will likely increase again going into spring. However, when we compare the August listings for Sydney, at 27,614 with Brisbane’s August listings at 29,587 it’s not hard to see why there is so much upward price pressure in Sydney. Melbourne listings have actually been falling, and that city had only 30,055 listings, down 15.3% on the year prior. The big fall is in Hobart, where listings have fallen 20.2% YoY, and asking prices have increased 2.2% over the week to 5 September, and 14.2% YoY. It looks like more Taswegians are hanging onto their cheaply priced little slices of paradise.
Interest Rates
Global yields fell in August as investors sought safer ground in bonds and gold. The Australian 10-year Treasury yield rose from 2.68% to 2.71%, but was still down on its March peak of 3.05%. This resulted in a flat return for the Bloomberg Australian Bond Composite 0+ years index and a -0.66% figure for the year to 31 August. This is due to bond rates being generally slightly higher than this time last year, and the lower mark to market value of longer dated bonds that come with that. The bank bill index did slightly better, with a gain of 0.14%. Global bonds as represented by the Barclays Global Bond Agg index gained 0.96%, and showing 1.04% for the year to the end of August. This gain was helped along by the US 10-year Treasury yield which fell from 2.30% to 2.12%. Clearly the bond market is not yet willing to hitch its wagon up to the Reflation train just yet.
The RBA kept the cash rate steady at 1.50% during the month. They did point to a more bullish employment outlook versus previous months. However, it is a challenge to achieve a balance between stimulatory monetary policy and the medium-term risk of high and rising household debt. Add to the mix an appreciating dollar over recent months, which will likely contribute to subdued price pressure, and it seems rates are destined to stay on hold for some time yet.
Household Finances
We include a chart of household finances this month to illustrate the rock on one side of the RBA, and the hard place on the other.
The hard place is the level of household indebtedness.
In the chart below we see how much debt has risen for the average household. The right-hand panel shows the amount of average income it takes to service that debt.
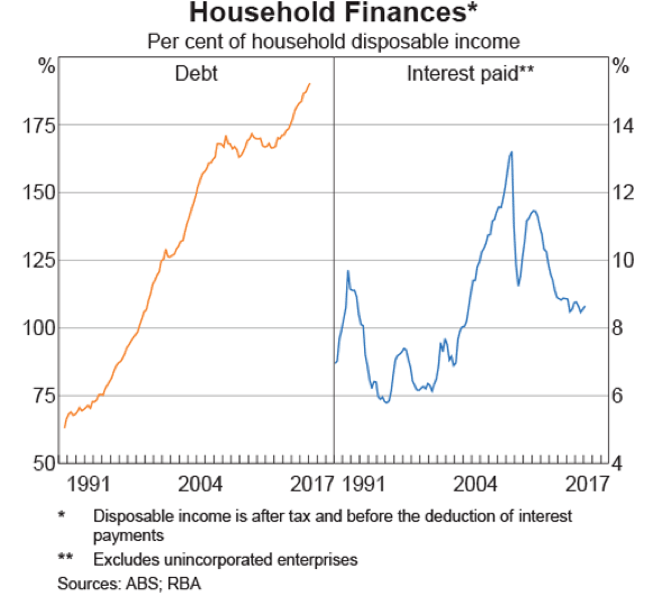
You will note that back when interest rates peaked in the late 80’s at around 18%, it took just over 9% of average after tax household income to service the average debt. Now that we have record low interest rates, it still takes almost 9% of average (and a whole lot more in the marginal borrowers) to service their debt. This is thanks to the now much higher household debt levels, which have also helped to push up house prices. At present, with benign inflation it is only the ‘rock’ that the RBA has to worry about. If ever inflation really starts to pick up, and interest rates need to rise will the RBA have to worry about the ‘hard place’. Food for thought if you are increasing debt right now.
The property market, you will probably know that we don’t often comment on residential property. Due to it being such a heterogeneous asset class (the opposite to homogenous) there are pockets performing differently everywhere. However, given that most of us will have some exposure, we have included some observations from SQM Research to update you on the broader market.
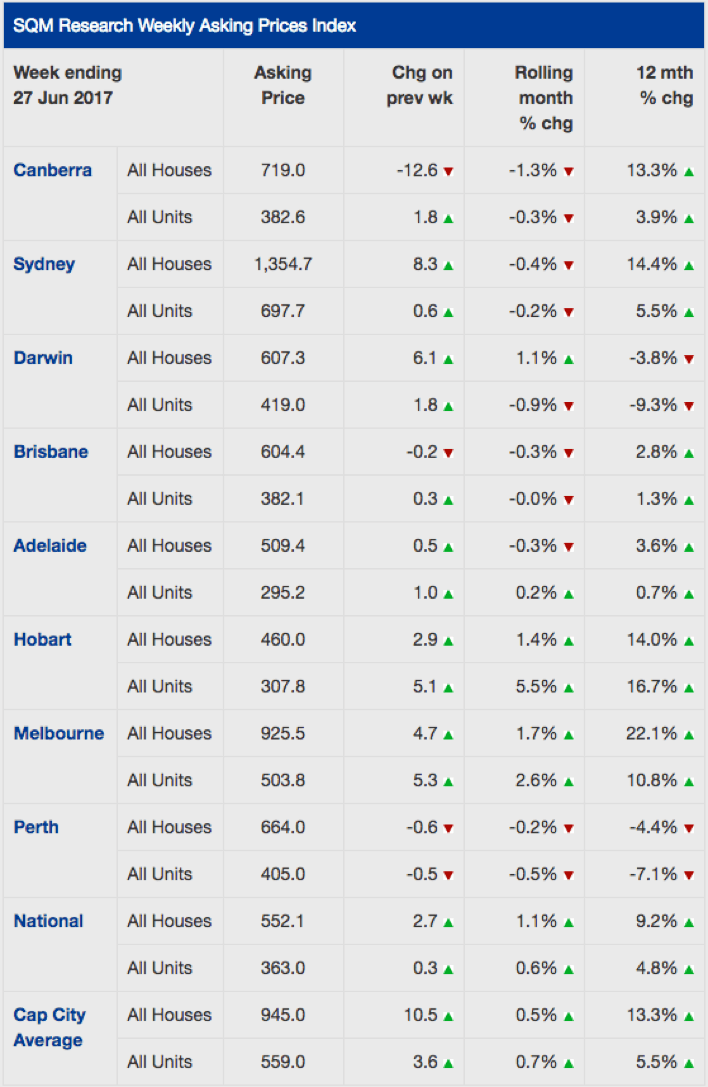
Source: SQM Research
Perth and Darwin prices are the only ones showing year on year falls. We recall only 2 years ago being offered apartments in booming Darwin to ‘sell’ to our clients. Our scepticism and avoidance of conflicts of interest kept us well away from that disaster.
Over the month of June, Sydney prices are showing a small decline, though year on year was strong. Melbourne too was a standout, with even bigger gains than Sydney. Hobart off a low base showed strong gains as well.
While we are not local market experts in each suburb, we do caution that a lot of those rises have come from availability of credit, and ultra-low interest rates. With the APRA edict to limit interest only loans, the banks are taking the opportunity to re-price those loans to a much higher level. If they execute that well, then there will be extra profits for the banks, and not too much pain for residential investors. We hope!
After a big sell-off in May, (-4.01%) the S&P/ASX200 Accumulation index managed a small gain of 0.17% for the month of June.
That was better though than Global markets, where the MSCI World index (in Aust Dollars) lost 2.54% for the month.
Bond markets sold off during June as interest rates rose, and the A-REIT sector (real-estate trusts) also had a fall, losing 4.51% over the month.
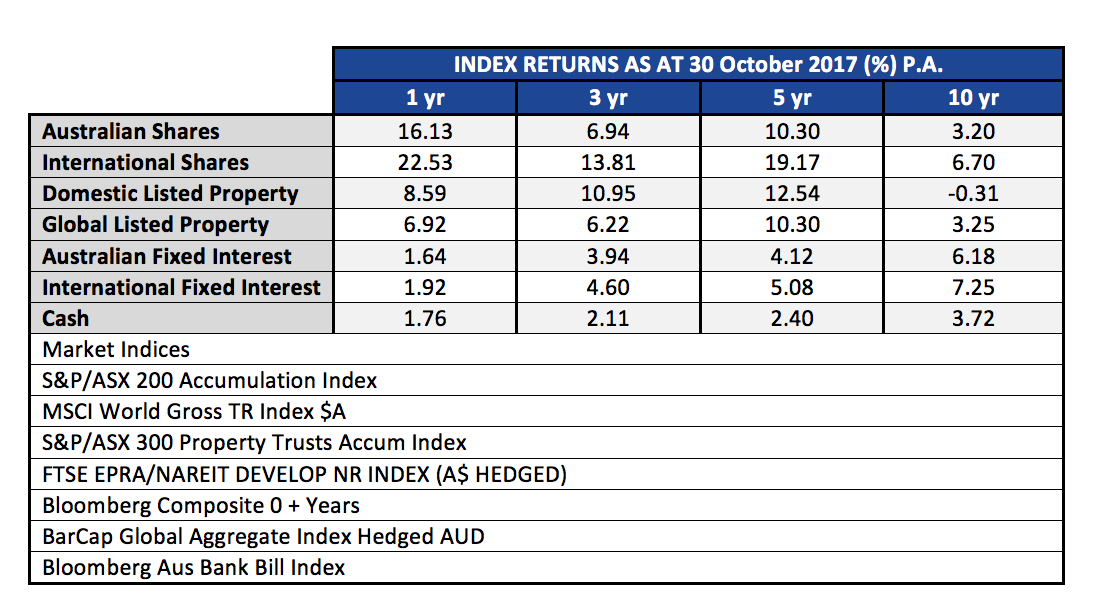
In spite of those falls, stepping back a bit to look at the whole year shows a much brighter picture of returns. The table below looks at the major liquid asset classes over the last ten years.
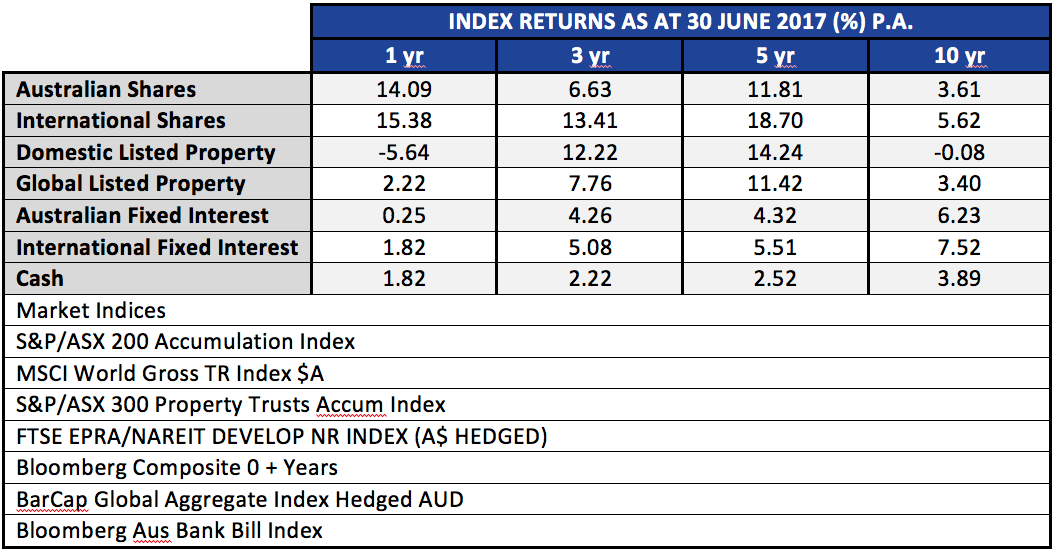
There are a few notable points here. The one, three and five year returns for Australian and International shares have been very positive overall. Yet, when looking at the 10 year numbers, the returns from those assets are below the Fixed Interest returns. And, when looking at fixed income returns we see that the returns this year have been low, lower in fact than a simple ‘buy term deposits’ strategy. Clearly timing is important, yet we are often told that ‘market timing’ is a fool’s errand. That debate is for another day, but we make the point that a thinking person needs to be able to bring into perspective the nuances of different rolling time frames.
As we now know from history, October/November 2007 was the peak of markets pre GFC. Markets all bottomed in about March 2009. These ten year numbers in the table above look sick now, but 18 months from now, they will start to look fantastic as we roll off the prior periods, and have a starting point that is very favourable.
But we must beware of extrapolating with no reasonable basis. Those five year numbers for the shares and property are unlikely to be repeated in the next five years. The temptation for in-experienced investors is to chase last year’s winner. Invariably rotation happens within markets.
What piques our interest is that which is out of favour. And the A-REIT market falls into that camp being 11 months into a correction. Our general view last year was that it was hard to find compelling value in the sector. As a result our exposures have been relatively low. From 1 August to 12 July the A-REIT sector has declined 14.88%. Those kind of moves get us interested. Former market darling Westfield with global assets and Scentre Group holding the Australian Westfield centres, has been taken a big hit, down around 25% since the peak back in August 2016.
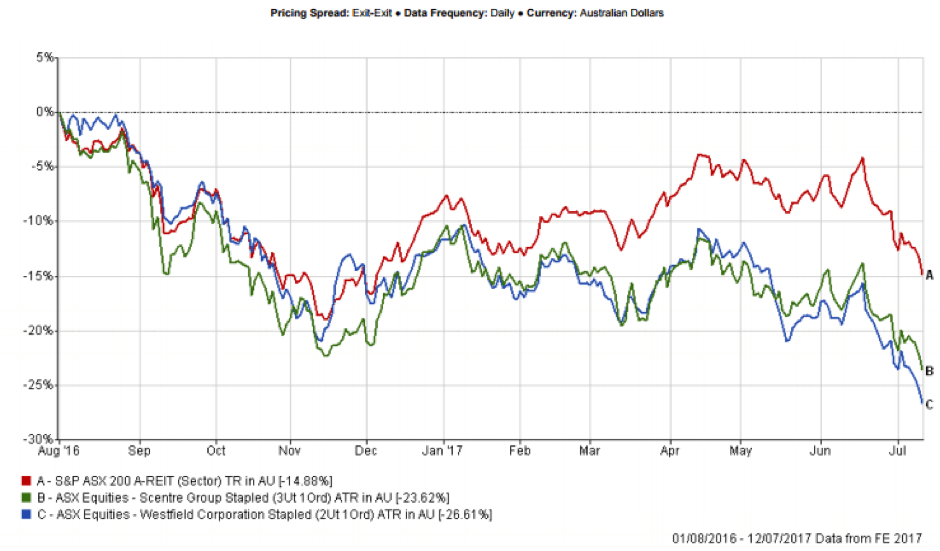
Make no mistake, Amazon will not kill the retail mall. And as the saying attributed to various wise men from King Solomon to Abraham Lincoln goes, “This too shall pass”!
Stock Markets
Our last update marked a short-term peak in the ASX200 which made a high at 5956 on May 1st. Since then, we had the release of the Federal Budget which was widely criticised as a ‘Labor lite’ budget, and plenty of international political events to keep us on edge.
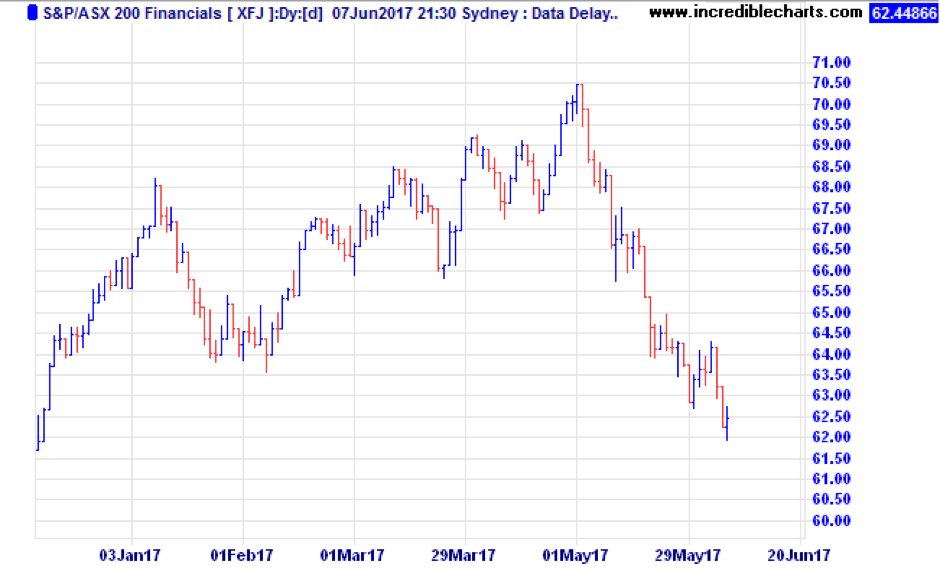
The ASX200 was down 4.01% during May. The Financials index (XFJ) was down almost 10% as bank stocks were pummelled. All the talk of housing bubbles, the bank tax announced in the budget, and plummeting retail sales have finally converged to bring share prices down.
Offshore, however, the news was better. The S&P 500 index of US shares gained 1.1% in local currency terms, and converted to Australian dollars was up 1.87%.
The MSCI World index in AUD was up 2.68%, and the MSCI Emerging Markets gained 3.45%.
Europe was the big gainer, with that market up 5.31% in Australian dollar terms. It helped that the Australian dollar fell 2.8% against the Euro during the month.
The month of May was a great example of the benefits of portfolio diversification in action.
Commodities
As a country that makes most of our money digging holes and building houses, the commodity markets are very important. In terms of export dollars earned, the big ones are iron ore and coal. While not as important to the export earnings, oil certainly rates highly for the big Australian – BHP. Iron ore was down 15% over the month, to end at $57.90, while coal dropped 11.7% and oil was down 2%. The Materials stock sector held up remarkably well in the face of this, down less than 1%.
That other commodity we have in reasonable abundance, denounced by some as a ‘barbarous relic’ is gold. Gold is at an interesting juncture, as it has broken free of the recent correlation with such grubby commodities as iron, oil and coal, and has just broken above a downtrend line that goes back to the peak in September 2011 when gold peaked at $1,882 per ounce. Now, at $1,294, it is slowly grinding higher, helped by the fact that US interest rates look like they’re rising at a slower rate than previously expected.
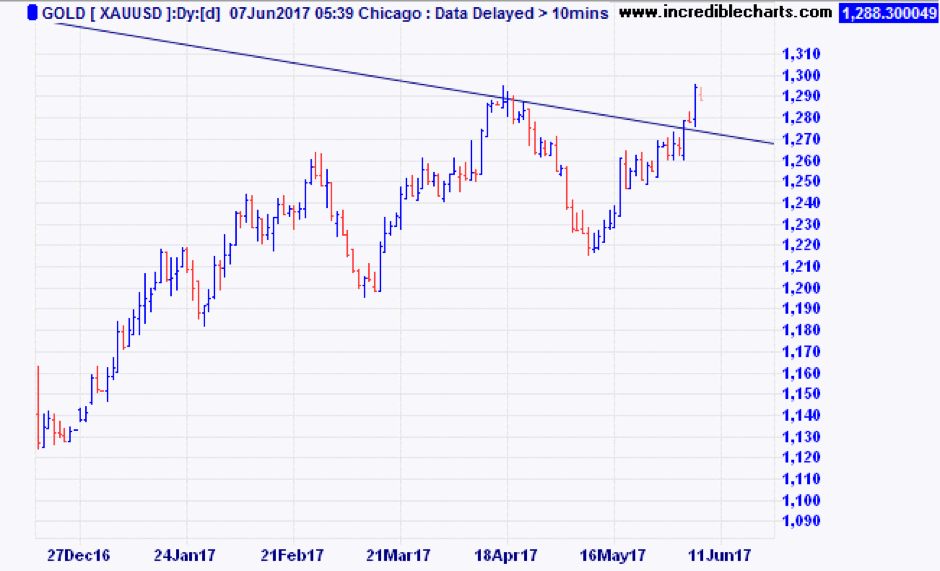
If gold can sustain a rally into the $1,320 level, it will be looking good, and the next target to break would be $1,360.
Interest rates (updated to 7 June)
At the June meeting, the RBA decided to leave the cash rate at 1.50%, following the same decision in May. The decision was expected given underlying economic conditions still warrant an easy monetary policy.
Immediately post the announcement, equity markets had fallen (due to the RBA’s rather upbeat comments) whilst the Australian dollar was flat. The decision comes as no surprise, given we expect the RBA to be on hold this year and most of next year.
In spite of the RBA being on hold with interest rates, we do see banks becoming more selective in mortgage lending, and there is some risk of credit rationing in postcodes that are deemed high risk.
Comparing some of the rates from the big four lenders, owner-occupier loans seem to be mostly priced around 4.40% for variable rates less than 80% LVR, while investor loans are in the 4.80% to 5.20% range.
Borrowers should also be aware of APRA’s directive to the Australian banks to have less than 30% of new loans written as interest only and to keep below an overall 10% per annum growth in investor lending. If you want to get the inside story on the APRA directive, it is available here: APRA Sound Residential Lending Practices.
The winning streak continued in April, despite a war footing in Syria and North Korea, and the first round of the French elections which soundly booted the two mainstream contestants and set up a run-off between Marine Le Pen and Emmanuel Macron.
The ASX200 accumulation index gained 1.03% during April. The bigger gains were in the banks, while miners were off about 2.2%. The positive result masked a few shockers during the month, like Telstra down 8.7% and upstart competitor Vocus which lost 22.4%.
Over in the A-REITs (listed property trusts), the gain was 2.61%. This was helped by falling interest rates, with the Australian ten-year government bond starting the month at 2.70%, sliding to 2.47% mid-month before settling at 2.56% at month end. The prices of listed property trusts are highly sensitive to changes in interest rates, especially in this period where the general consensus is that US rates are on the rise. The A-REIT sector current yield is around 4.7% and the sector trades at a 23% premium to net asset values.
Turning to global markets, the S&P 500 index of US stocks gained 1.03% in April in local currency terms, but when converted back to Australian dollars the gain was 3.05% as the Australian dollar fell against the US Dollar over the month. The broader MSCI World index gained 1.33% in local currency terms, and 3.64% when converted back to AUD. In other regions, the MSCI Europe index gained 5.76% in AUD terms, as investors flocked back into the main Euro markets following the first round of French elections. The MSCI Asia ex Japan region gained 4.23% in spite of the serious tensions in North Korea.
Interest rates have been mentioned earlier, with reference to bond yields falling, which in turn increases the price of bonds, and the longer the term to maturity the higher the increase. The Bloomberg AusBond 0+ years index gained 0.69% during April. This was a turnaround from the previous six months (Oct ’16 to March ’17) when the index lost 1.21% in value thanks to rising interest rates that followed the surprise Trump election. We thought it would be useful here to comment on the impact of rising interest rates on the ‘average’ index tracking fixed income fund. In the period between 1 October 2016 to 16 December 2016, the US ten-year bond yield rose from 1.6% to 2.6%, an increase in nominal yield of 1.00%. The Bloomberg AusBond 0+ years index lost 2.66% of its value over that period. It is important to understand how fixed income, with longer durations to maturity, can suffer losses in a rising rate environment. Further, relating this to our earlier comments on A-REITs, that sector lost 6.17% during that period when US rates rose by 1.00%.
Overall, April was a fairly good month, in spite of the intra-month volatility.
Coming next week is our Australian Federal Budget. As we write this, the RBA board is meeting, but no-one is expecting any change to rates. Also this week, the RBA Governor speaks on “Household Debt, Housing Prices, and Resilience”. We all know that as the person at the head of the organisation charged with ‘financial stability’, he will most likely avoid the word ‘bubble’, but we would expect him to try to hose down people’s price expectations.
In late news over the weekend, we are watching closely the situation of a Canadian lender, Home Capital. It has about $20B in total assets, with about $15B of lending into the red-hot Canadian residential real estate market. The bank has just set up lines of credit for about $2B to replace depositor funds that sources say are leaving at over $200M per day. An old-fashioned bank run. Apparently, there has been some fraud among the brokers that wrote loans for the bank. As if that is not enough, there is also some shenanigans with the funding of this latest line of credit, which reportedly may be costing between 18 and 22%. Clearly, that is a whole lot higher than the rate Home Capital are earning on their home loans.
Our next update will be a summary of the Federal Budget.
The US Federal Reserve lifted interest rates by a quarter of a percent this week. According to normal expectations this was supposed to result in:
- Falling stock prices
- Rising bond yields
- Rising dollar and;
- Falling gold prices.
Guess what happened? None of the above. In fact, in all four assets the opposite happened.
- Stocks rose by almost 1%.
- The 10-year bond went from 2.6% down to 2.5%.
- The US dollar fell by more than 1% against the Euro and Yen and almost 2% against the Australian dollar.
Rising interest rates were supposed to make the US dollar stronger! And rising interest rates were supposed to make gold less attractive. Yet gold rallied by $20 or 1.7% on the night.
All four of those major markets went the opposite direction to what economic theory would tell you.
Why is this so?
It’s all about ‘buy the rumour – sell the fact’.
When an event is expected so widely as this Fed rate hike was, traders get themselves positioned well before the event. Sometimes the trade is so crowded that once the rumour becomes fact, everyone is positioned on the same side of the trade.
The interest rate rise at this month’s Fed meeting was indeed widely expected.
The minutes of the meeting confirmed what we had been thinking for some time, that interest rates, whilst increasing, would be at a moderate pace compared to previous cycles.
The global debt load, which has only increased since the GFC, means any little ‘pull of the lever’ (moving interest rates) can have a big effect, and as a result central banks around the world will continue to be cautious about the pace of raising interest rates.
What next?
Based on the market reaction to the Fed increase on March 15, we would expect that another two rate hikes this year in America could be absorbed without requiring the Reserve Bank of Australia (RBA) to make any increases at all.
We suspect the RBA would like to raise interest rates to fire shots across the bow of property investors, reminding them that rates can go up as well as down, before speculation gets out of hand. However the still weak economy and the risk of pushing the dollar higher is likely preventing that in the short-term. APRA and the RBA are more likely to wait and see if there are some adjustments to negative gearing and CGT in the budget to rein in property speculation.
What’s the lesson?
The lesson from the market reaction to the Fed rate increase is that positioning is best done well before market events. Market participants tend to look at least 6 months ahead and get well positioned before announcements of things like GDP and inflation numbers, and often when the expectations are correct, markets move opposite to what might be expected, because the marginal buyer and seller is already well positioned for the event.
The January Effect. Can it predict where the market is going? Is there a better indicator we should watch?
In the early days of 2017, plenty of journalists were dusting off their old “January Effect” stories. Give it a tune up, add some new stats, and there you go, a half page story without too much effort…
So, what is this January Effect?
Let’s start with the general thesis. January is often a good month in US stockmarkets. The US tax year ends on 31 December, so you can get a lot of tax loss selling in December pushing prices down, followed by renewed buying of those dumped stocks in the first five days of January. The market moods seem to be set early in January, and the price action during the full month sets a positive or negative tone for the year. Standard and Poors data shows that since 1929, the direction over the month of January has correctly indicated the direction for the rest of the year 73% of the time. In other words, when markets were up in January, the market was up nearly three out of four years. And if the first five days were up, then the market finished up 86% of the time, for an average gain of 14%.
So that looks like a good trade! The S&P 500 was up 1.3% in the first five days, and up 1.7% for the month. Looking good so far.
But how did Australian investors fare?
Well, the rise of the Australian dollar had a nasty impact on international shares. The US S&P 500 index, converted back to Australian Dollar (AUD) was down 2.8% thanks to the 5.3% rise in the AUD (dividends cushioned the blow somewhat).
The broader Morgan Stanley Capital Index (MSCI) of global shares declined 2.29% during January. Our local ASX200 index was -0.79% while smaller companies fell 2.4%. No joy in listed property trusts (A-REITS) which were -4.71%
So the January Effect gets a bit murky. Do you rely on the US dollar version? Does the January effect make us worried about Australian shares? The truth is, anything can happen. Previously observed events can lose their efficacy if too many people become aware of the probabilities. It really is not something that investors should put too much store in, just as they shouldn’t fear the month of October.
But what can we learn about history and negative market moves?
An interesting chart we wanted to share this month comes from JP Morgan.
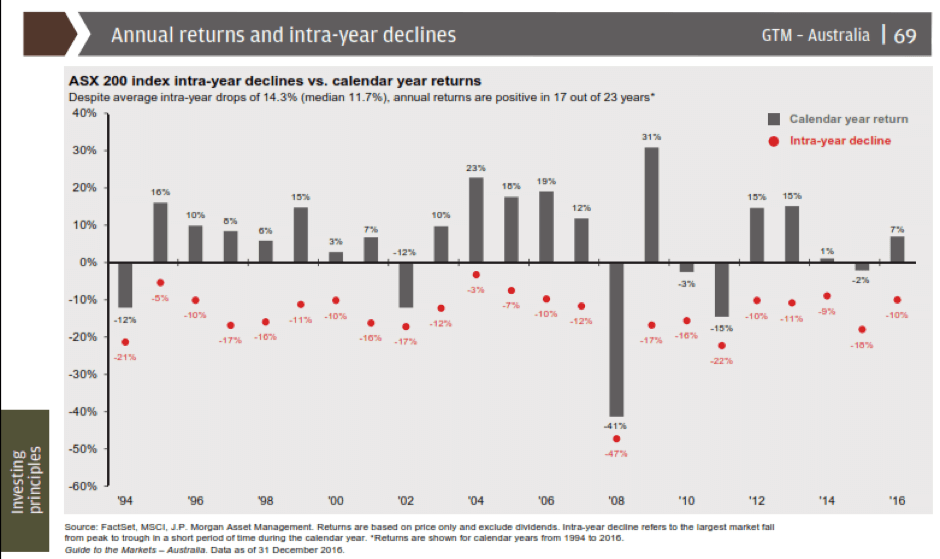
This chart shows intra-year peak to trough declines as red dots, and the full calendar year Australian share market returns in the grey bars. (If it’s a bit blurry, just email your adviser for the full copy)
What we observe is that over the 23 years, the median intra year decline has been 11.7%, while the average has been 14.3% thanks in part to the big crash in 2008.
If we were to look at market declines as a ‘buying opportunity’ for any cash we have on the sidelines rather than a cause for panic on the existing stocks we hold, it could add significantly to our overall returns.
So let’s set the scene then for where that ‘buying zone’ might be in 2017.
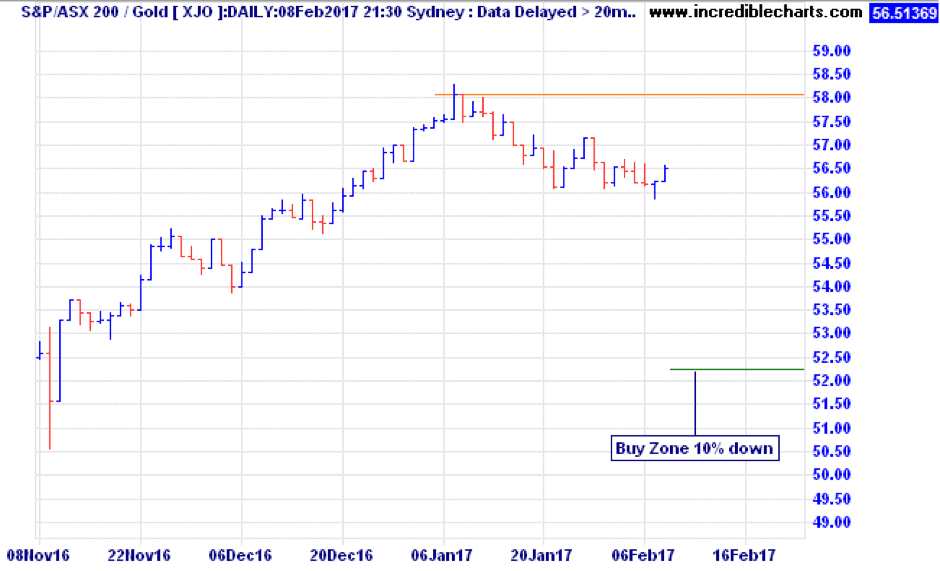
So far the market high this year has been 5807 points as measured by the ASX200 on the 9th of January. A 10% decline from that level would take us down to 5226 points. That degree of decline has odds of at least a 74% chance of happening based on the last 23 years. So don’t fight it, embrace it. And what if it doesn’t come this year? Don’t worry, there’s always next year! The only time we had two back to back years with less than a 10% decline was 2004 and 2005 when markets were much cheaper than today.
Happy investing!
If last year was the year of shocks and surprises, this will be the year of discovery as to what those surprises deliver. Britons voting with their feet to leave the European Union and the star of a Celebrity Apprentice show getting the gig as the most powerful man on the planet are two of the biggest surprises. Yet the biggest surprise of all is how well markets have handled these two surprises and the uncertainty they bring.
Before we start to consider what may be in store for 2017 it is worth looking back at the winners and losers in 2016.
2016 Market Returns
Looking at the table below, one could be thinking that 2016 was a fairly benign year, with double digit returns in Australian Shares and listed property, and nothing in the negative. But looking only at the ‘year to year’ figures within those top performers hides some large intra year divergences. For example, from 1 January, the ASX 200 fell around 10% into early February. That level of decline is actually slightly less than the median 11.7% drawdown that the ASX200 has suffered in the last 23 calendar years. From the peak in April 2015 to the low in February 2016, the ASX200 was down by 18.9%.
From early August to mid-November, the A-REIT sector (listed property trusts) fell 19.2% along with other interest rate sensitive sectors as bond yields started to rise. Even the fixed interest sector was not exempt from losses. Although the full year showed a return of 2.92%, the index of Australian Government bonds lost 3.8% in the last quarter as interest rates rose and bond prices fell.

So what could happen in 2017?
President Trump
Trump becomes 50% politician 50% businessman. He fails to keep many promises, including the building of a great Mexican wall. He is brought to heel on some of the trade agreements he promised to tear up. But with the compromise, his Republican members come around to the idea of running up more debt to stimulate the economy and re-build the country’s infrastructure. This helps with more construction jobs, but fails to bring back the manufacturing jobs that were lost to Mexico and China. A confrontation is likely. Be it North Korea, China or Russia, one of these is going to push the boundaries and Trump is likely to relish the fight. Let’s hope it’s just words and doesn’t escalate.
Europe
The rest of Europe starts to weigh the benefits of remaining in a currency union, when possibly a trade bloc would be almost as good. It won’t happen in 2017, but the voices will grow louder. There will be winners and losers out of this, but keep in mind that whether you are German or Greek, you still like to eat, drive, sleep in a house, take occasional vacations; so life and the economy will go on.
US Interest Rates
US Interest rates move higher but only gradually. The rises are still less than the forward looking estimates of the Federal Reserve committee (which are made public, and often referred to as the ‘dot plots’). The move is limited to two hikes this year taking the Fed Funds rate up to a target of 1.00% to 1.25%. Australian longer term interest rates also rise, but again, it is likely to be modest. Currently the difference between yields on the Australian ten year bond and the two year bond stand at 0.80% (80 basis points). Only on 4 occasions in the last 20 years has this spread spiked to above 100 basis points. So unless you see a case for the short end (RBA Official Cash) rising dramatically, then the long end should only move up modestly. However, long duration fixed income funds will continue to face headwinds.
More volatility
As mentioned, this is not unusual. Trends do not go on forever and the worst strategy is loading up on last year’s winner. In fact LVX Research recently published a paper showing stellar returns from picking the five ASX100 stocks with the worst 5 year trailing returns.
The rally since the Trump Election could well be coming to an inflection point and some have postulated that his inauguration will prove to be the turning point. One doubts that it would be that obvious, and as we have learned last year, expect the un-expected. Whenever it happens, given the strong run-up, it should not surprise anyone if we see ten percent decline in shares. In fact, there is an 82% chance that during the year we will see an equities decline of that magnitude. (Only 3 years in the last 23 have had intra-year declines of less than 10%).
China
China continues to be the ‘swing factor’ in our sharemarket. Stimulus there has driven coal and iron ore prices higher, providing strong gains in our bulk commodity exporters. Overall Chinese corporate and SEO (State Owned Enterprise) debt as a percentage of gross domestic product (GDP) remains higher than the US, but since the Communist regime makes it much more palatable to have governments bail out SEO’s and Municipal Governments, a debt crisis there is likely to have a lesser impact than in the Eurozone.
Valuations
The 2017 Outlook won’t be complete without a mention of valuations. At 31 December, the ASX200 estimated forward Price to Earnings (P/E) ratio stood at 16.6. The 10 year average has been 14.3. You could say that compared to history the Australian sharemarket needs to be 13% lower to be at the average P/E ratio. However, those 10 years were at interest rates much higher than today, so maybe the current valuation can be justified.
Global equities are at 16.1x expected forward earnings, and the ten year average is 13.8x. A similar overvaluation case can be made there. And the US market, at 17x forward earnings, has about 14.5% of downside to hit the 10 year average of 14.5x. Perhaps the cheapest market in the world is Russia, which trades at only 6.6x earnings, and 80% of book value. Buying Russia might be a bit extreme, but Korea is interesting at 9.7x earnings and a price to cashflow of only 5.1x. As you can see, though many markets are expensive, there are pockets that are cheap. We find a similar situation in banks. Australian banks are now relatively expensive, but there are ‘digital disrupter’ banks in Europe that trade on very attractive valuations, without the baggage of the larger established banks.
Conclusion
As always, diversification and quality asset selection are the keys to success. It is fairly easy to identify quality assets, but knowing the right price to pay for those companies is what requires experience and skill.
Not chasing winners – but rather being willing to buy last year’s loser could be a good trade. It worked this year with the Metals and Mining index up 52.7% for the year. For the record, the worst sector in 2016 was Telecoms, down 7.1%, followed by Healthcare which managed only a 1.9% gain. The Asia (ex Japan) index had a poor return in 2016, but as a result now trades at only 13X forward earnings, versus 14.2X historically. Although this area disappointed us in 2016, we maintain a positive five year view on the region based on demographics and valuations.
Ensuring capital is available to invest during those inevitable market sell-offs should also be a rewarding strategy.
Remember, investing is a marathon, not a sprint, so don’t let the volatility get the better of you, rather make it work for you. All the best for 2017!
Arnold Horshack was the character in “Welcome Back Kotter”, who famously said, “when you least expect it – expect it!”.
It seems like 2016 will go down as the year of getting what we least expected, with outcomes that were even less expected!
Brexit and Trump were the two least expected outcomes, with grave concerns of what would happen to financial markets in either event.
Turns out the least expected outcomes are those that have come to pass.
Last weekend, Italy voted on changes to the constitution for the purpose of strengthening the lower house of parliament against the Senate. The government would then have some hope of actually passing some laws that would modernise the labour markets and other areas of sorely needed economic reform.
After a resounding NO, Prime Minister Matteo Renzi has resigned. There were concerns that the resulting political instability would turn attention back to the plight of Italian banks. Estimates are that Italy’s banks have EUR380 billion of bad loans, and continued political instability will make it less attractive for private capital to provide further support. But no, markets have completely taken that in their stride, and barely missed a beat. The Euro crashed to USD1.05 but then rebounded the same day to USD1.075.
The Austrian elections have installed a Green Party leader. Voters have turned their backs on major parties, and that market was up 2.5% in the following two days.
Next year, the big event is the first round of voting for the next French President on 23 April. Socialist president, Hollande, has decided not to run, leaving many questions open and the far right ‘National Front’ leader, Marine Le Pen, gaining in popularity.
Whatever the outcome, we do need to be prepared for, and not spooked by, the accompanying volatility.
Our first chart helps to visualise the impacts of the Brexit and Trump surprises.
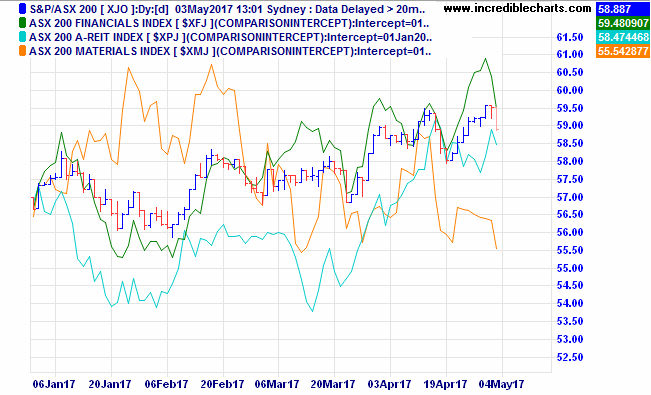
A familiar pattern shows up. Polls favouring the ‘expected’ result in a buoy in the market in the days leading up to the event (first green arrows). Then, the unexpected shock hits the market (down arrows in red). Lastly, we get the realisation that maybe it ‘won’t be so bad after all’ and markets get back on track.
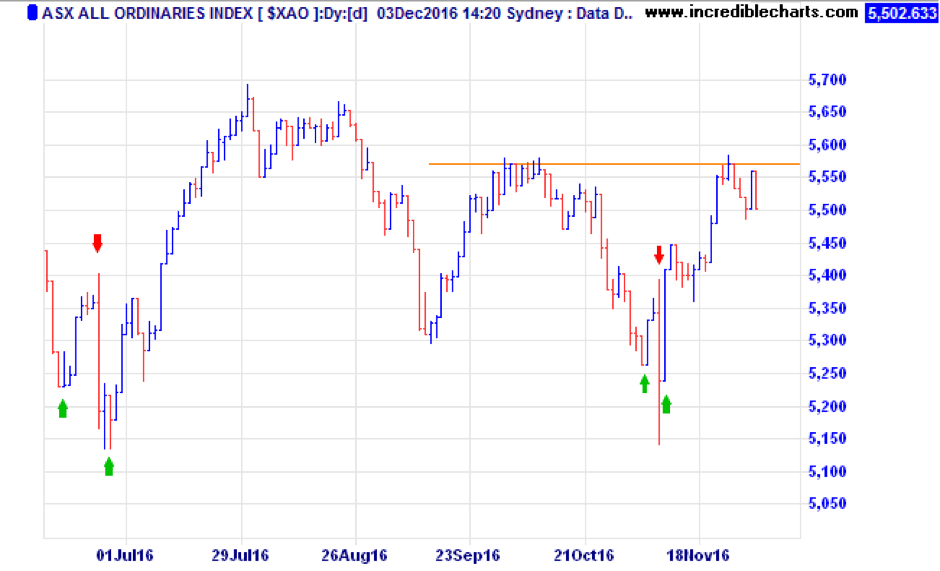
As an aside, right now the market is having a struggle breaking through the highs that were made after the post Brexit rally. A move above 5500 on the ASX200 or 5580 on the All Ords is required to confirm the rally that is underway.
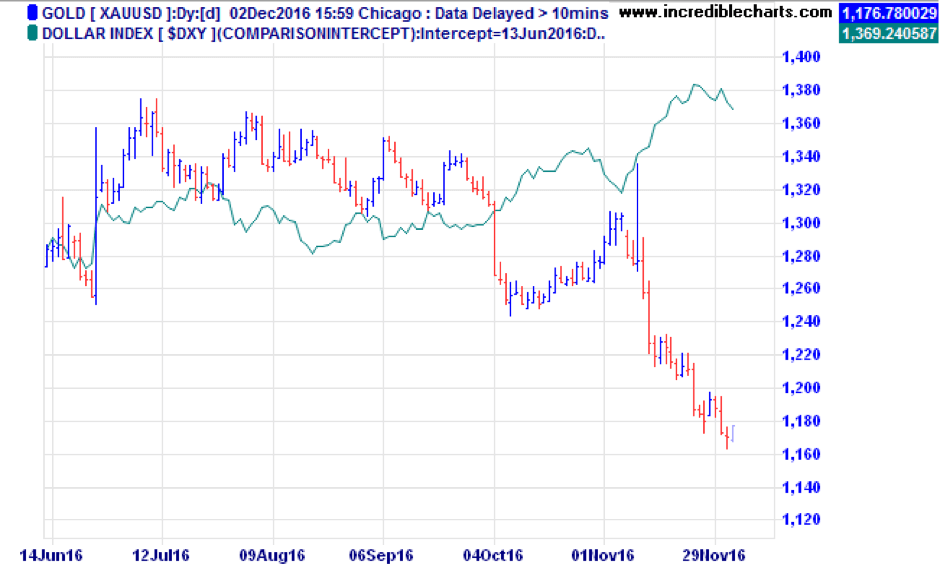
Another chart we want to share this month is the USD index (basket of the USD vs trade weighted currencies) and its relationship to the gold price.
Since the Trump win, the USD has strengthened (again – unexpectedly) while gold has sold off. The strong dollar/weak gold is a traditional relationship, and you can see this very emphatically since the early November Trump surprise. The strong dollar run does however show some early signs of easing. Australian gold stocks have sold off heavily in the last three weeks, so it will be interesting to see if the dollar is topping and whether gold can find a bottom at these levels.
The other chart we wanted to share is that of the ten year US Treasury bond, where the rise in yields has resulted in a sell-off in yield sensitive sectors. We (and others) previously identified these as the ‘expensive defensives’ that we wanted to avoid, or at least restrict to low exposures to in our portfolios.
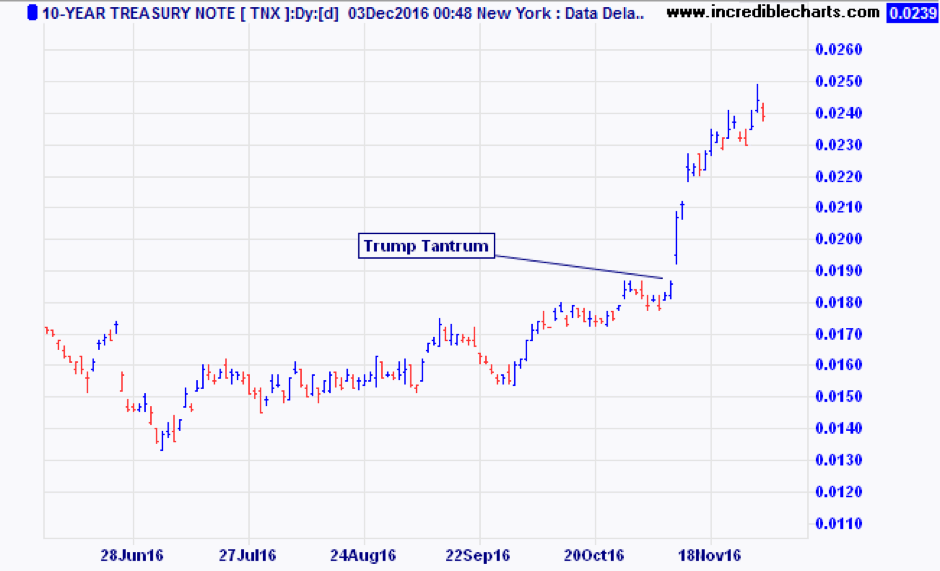
In our fixed interest portfolios, the primary position has been to hold short maturities in preparation for this exact risk. The funds we use in this sector generally have a mandate to shorten or lengthen the duration, taking advantage of sell-offs like these.
The other big event that is yet to come this year is the Fed meeting on 15/16 December. It is widely expected (92% odds) that the US Federal Reserve will hike the short term rate to 0.50% at that meeting. That rate hike is fully factored into markets already. It will be a matter of how many hikes follow in 2017 that dictates whether the sell-off in yield assets is a buying opportunity, or just the start of a larger rotation into cyclical stocks.
All we can say is, “expect the unexpected’ or, in the words of Arnold Horshack “when you least expect it – expect it!”.
Our portfolio management strategies are positioned to be resilient in the face of volatility, and in many cases to take advantage of it.