

The S&P/ASX 200 Accumulation Index had a blinder in June, up 3.27% for the month, continuing the positive trend that started in April. The market has run up 7.33% from the 4th of April low to 30 June. CSL gained 3.6% in June, and was up 39.5% for the year. More on the Growth/Value gap later.
The Australian Real Estate Investment Trust (A-REIT) sector continued to gain over one and three months, with gains of 2.27% and 9.82% respectively. The sector is also cycling to a decent 12 month gain of 13.20%. If that sounds out of synch with residential prices, it is because A-REIT’s had already suffered significant falls over a year ago, and bargain hunters have already been moving in.
| INDEX RETURNS AS AT 30 June 2018 (%) | ||||
| 1 month | 3 months | 6 months | One year | |
| Australian Shares | 3.27 | 8.47 | 4.29 | 13.01 |
| International Shares | 2.40 | 5.82 | 6.66 | 15.96 |
| Domestic Listed Property | 2.27 | 9.82 | 3.02 | 13.20 |
| Global Listed Property | 2.03 | 7.31 | 1.62 | 6.42 |
| Australian Fixed Interest | 0.48 | 0.82 | 1.69 | 3.09 |
| International Fixed Int | 0.17 | 0.15 | 0.06 | 1.85 |
| Cash | 0.15 | 0.49 | 0.92 | 1.78 |
| Market Indices | ||||
| S&P/ASX 200 Accumulation Index | ||||
| MSCI World ex Aust TR Index $A | ||||
| S&P/ASX 300 Property Trusts Accum Index | ||||
| FTSE EPRA/NAREIT DEVELOP NR INDEX (A$ HEDGED) | ||||
| Bloomberg Composite 0 + Years | ||||
| BarCap Global Aggregate Index Hedged AUD | ||||
| Bloomberg Aus Bank Bill Index | ||||
Residential property has continued to decline in the Sydney and Melbourne markets. The NAB Residential Property survey just released indicates a 3.7% decline expectation for Sydney in 2018, and another 0.7% in 2019. The anecdotal evidence would suggest real declines much steeper than that especially in ‘off-the-plan’ apartment re-sales where the property samples are more homogeneous.
International sharemarkets continued higher, in spite of the volatility that spiked in February, with the S&P 500 US index falling 10% in 2 weeks. Global shares for Australian investors gained 15.96% for the financial year, helped along by the Australian dollar which depreciated 3.69% against the USD and 5.80% against the Euro.
In terms of trends, we still see the US Market as being in a positive trend. Although it remains below the January 26 peak, it is building a base after the falls in February and March.
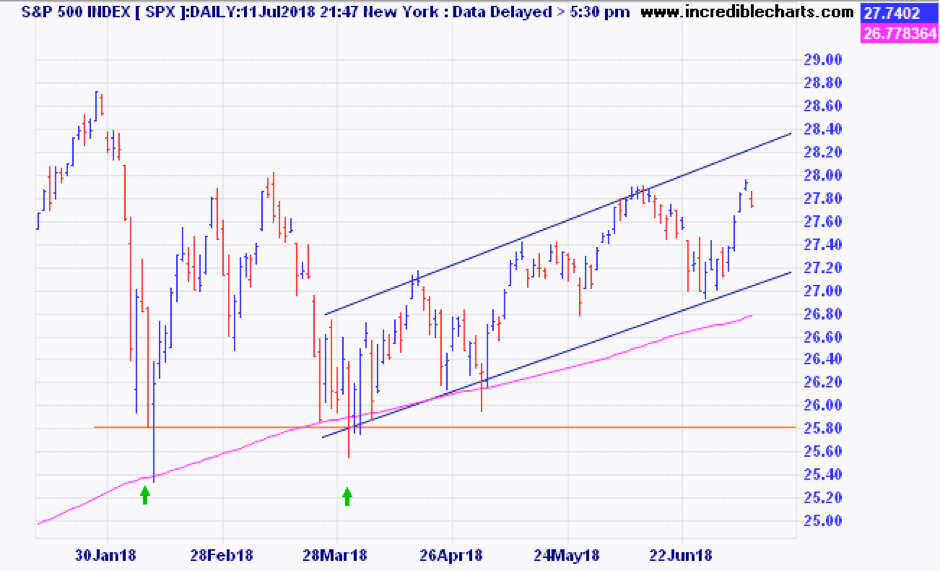
Note the two lows, in early February, and then early April, (shown with two green arrows) where the market found support at 2581 points on two occasions seven weeks apart. Since then the uptrend has been contained within a four percent range, with an upward slope. While the market stays in that uptrend we can only assume that the medium term trend remains positive, in spite of the rapid ramping up of trade war talk.
Turning back to the earlier mention of “Value” versus “Growth” it is very clear that the 2018 financial year was very rewarding for the latter and very difficult if you are a “Value” investor. The charts below from Investors Mutual (full disclosure – IML are a ‘value’ manager) show the divergence between Resources stocks and Industrial stocks over the last year.
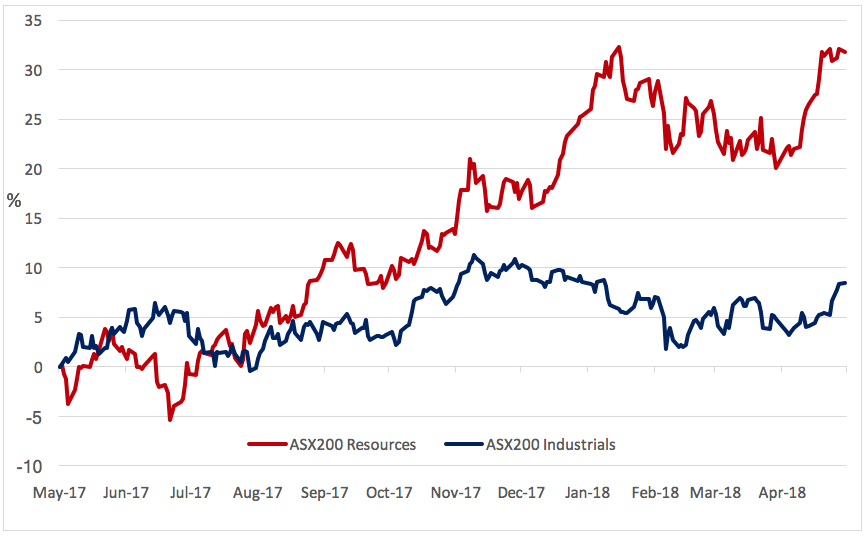
Chart source: IRESS & Investors Mutual
As you can see, if you were not at least ‘index weight’ in Resources (the red line), then you got left behind rather badly, and that is what happened to funds like Investors Mutual Australian shares.
But when you look at the longer term, you see that commodities producers who are generally price takers rather than price makers, have a somewhat less illustrious history.

Chart source: IRESS & Investors Mutual
Over the longer term, Industrial companies have outperformed Resources by a large margin.
Now, the industrials vs recourses comparison is not quite the same as the Value vs Growth argument, but we see similarities. According to research published by Schroders, in most rolling 10 year periods since 1936, the “value” factor (measured as lowest share price to book value) has outperformed the group of stocks with the highest share price to book value by a decent margin. For a look at the graphic representation please click through here: Why Value Investing May Be Primed to Bounce Back
Helping the growth stocks currently is the fascination with the FANG stocks, Facebook, Amazon, Netflix and Google. It is said that those four, along with Apple and Microsoft, contributed 30% of the S&P500 gains through 2017 and the first two months of 2018. For some perspective on these stocks and the risks that are emerging with everyone rushing to the ‘growth’ side of the boat, check out Jesse Felder’s great blog, The Felder Report.
If you have concerns about how well diversified your portfolio is, please give us a call at Quill Group.