

The Australian market had a fair month in August. Mark takes us through the performance across the board to prepare us for what’s to come.
Stockmarkets
The Australian market had a fair month in August, with the ASX 200 Accumulation Index posting a 0.71% return for the month, which annualises out to around 8.5% which is within a few points of our expected long term returns. The commodities price was the action sector with Energy shares (+6.07%) delivered the biggest gains.
The rolling one year historic returns for the ASX200 Accumulation index is now 9.79%, rolling off some good periods in FY 2017 which saw a great return of 14.09%. Sentiment on Australia remains patchy. Banks, our largest sector have plenty of sceptics due to the high capital city house prices, and highly leveraged consumers. Our other big sector being materials, seems captive to sentiment about what China will do next.
Looking globally, the MSCI World Index gained 0.85% in AUD terms during August, supported by Asian markets which we favour as having the lowest valuations, and most room for improvement thanks to demographics and lower levels of current consumer debt. The rolling one year historic return for the MSCI World in AUD is now 10.71%, while the Emerging Markets gained 18% over the last twelve months.
Property
The S&P/ASX 300 A-REIT Accumulation Index gained 1.51% in August after coming under pressure in July. It has been a relatively good reporting season for listed property. Both of the giant Westfield entities are still under pressure as the market realises that there is a breaking point with retail rents. Add to that the Amazonian threat, and we are seeing the big malls trade closer to fair value.
While listed property prices have come off recently, direct commercial, industrial and retail property sales continue at higher levels. In some sectors it is possible to buy trusts at a discount to the value of their assets when like for like sales of direct assets are compared. In addition those listed trusts give you 3 day liquidity, and no stamp duty.
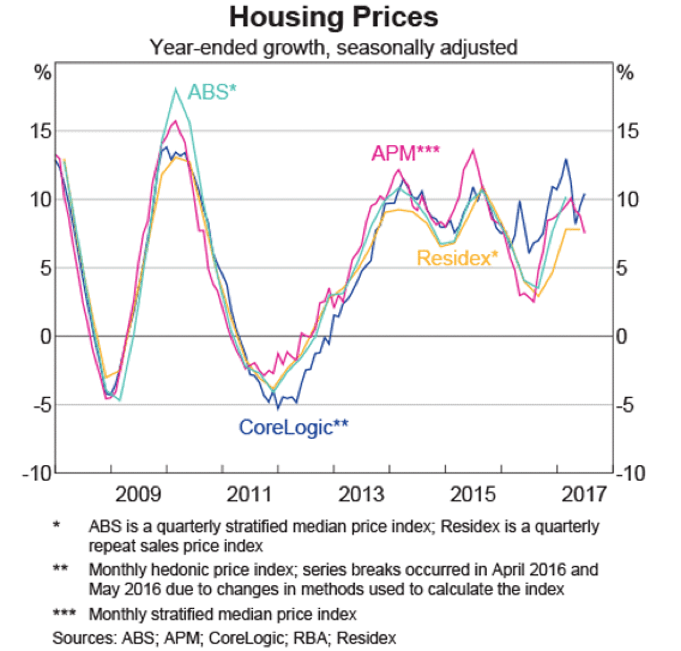
Residential markets appear to be softening in Sydney, but less so in Melbourne. Asking prices in Sydney fell by 2.5% over the last week, but are still up 12.5% year on year. Listing in Sydney rose 5% over the month of August, and will likely increase again going into spring. However, when we compare the August listings for Sydney, at 27,614 with Brisbane’s August listings at 29,587 it’s not hard to see why there is so much upward price pressure in Sydney. Melbourne listings have actually been falling, and that city had only 30,055 listings, down 15.3% on the year prior. The big fall is in Hobart, where listings have fallen 20.2% YoY, and asking prices have increased 2.2% over the week to 5 September, and 14.2% YoY. It looks like more Taswegians are hanging onto their cheaply priced little slices of paradise.
Interest Rates
Global yields fell in August as investors sought safer ground in bonds and gold. The Australian 10-year Treasury yield rose from 2.68% to 2.71%, but was still down on its March peak of 3.05%. This resulted in a flat return for the Bloomberg Australian Bond Composite 0+ years index and a -0.66% figure for the year to 31 August. This is due to bond rates being generally slightly higher than this time last year, and the lower mark to market value of longer dated bonds that come with that. The bank bill index did slightly better, with a gain of 0.14%. Global bonds as represented by the Barclays Global Bond Agg index gained 0.96%, and showing 1.04% for the year to the end of August. This gain was helped along by the US 10-year Treasury yield which fell from 2.30% to 2.12%. Clearly the bond market is not yet willing to hitch its wagon up to the Reflation train just yet.
The RBA kept the cash rate steady at 1.50% during the month. They did point to a more bullish employment outlook versus previous months. However, it is a challenge to achieve a balance between stimulatory monetary policy and the medium-term risk of high and rising household debt. Add to the mix an appreciating dollar over recent months, which will likely contribute to subdued price pressure, and it seems rates are destined to stay on hold for some time yet.
Household Finances
We include a chart of household finances this month to illustrate the rock on one side of the RBA, and the hard place on the other.
The hard place is the level of household indebtedness.
In the chart below we see how much debt has risen for the average household. The right-hand panel shows the amount of average income it takes to service that debt.
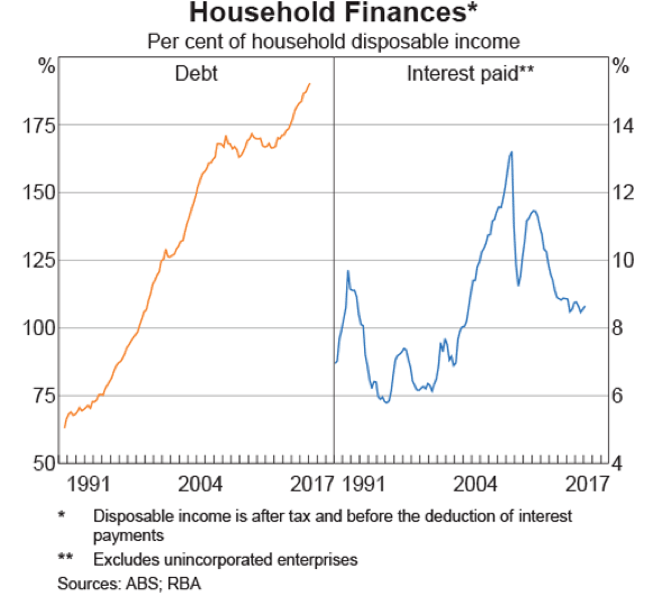
You will note that back when interest rates peaked in the late 80’s at around 18%, it took just over 9% of average after tax household income to service the average debt. Now that we have record low interest rates, it still takes almost 9% of average (and a whole lot more in the marginal borrowers) to service their debt. This is thanks to the now much higher household debt levels, which have also helped to push up house prices. At present, with benign inflation it is only the ‘rock’ that the RBA has to worry about. If ever inflation really starts to pick up, and interest rates need to rise will the RBA have to worry about the ‘hard place’. Food for thought if you are increasing debt right now.