The Australian Bureau of Statistics (ABS) released data in 2017 showing the increase of 2.3% for the average full time adult weekly earnings. With the average level of income rising every year, does this correlate to the average household expenditure, and how to save money?
The ABS has commented that their captured data of Australians and household expenditure doesn’t necessarily capture a household or families response to prices increasing. ‘Shrinkflation’, where the physical weight and package size is reduced by the manufacturer but the price remains the same, causes the price to rise and the increase in inflation, but is masked. Other factors may be where households choose to buy alternative, cheaper products, therefore not increasing their spending.
Household Spending in Australia | How to save money
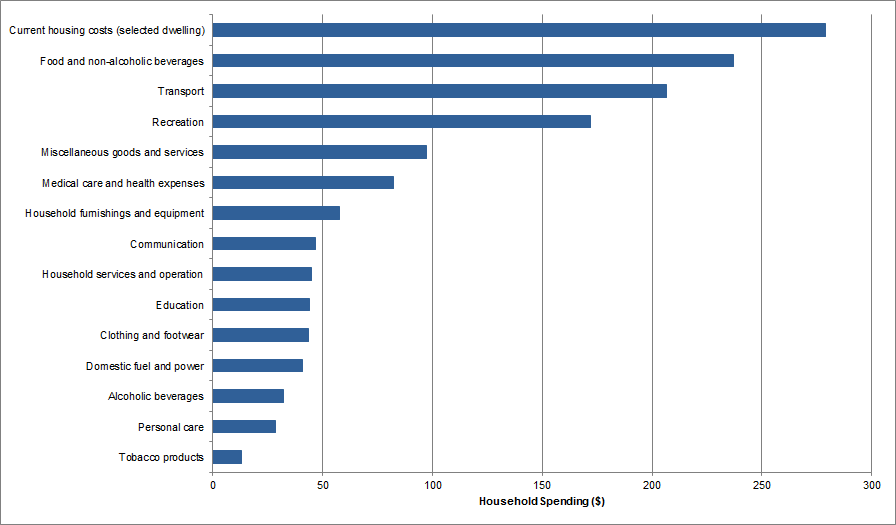
The below graph details the breakdown of weekly household expenditure.

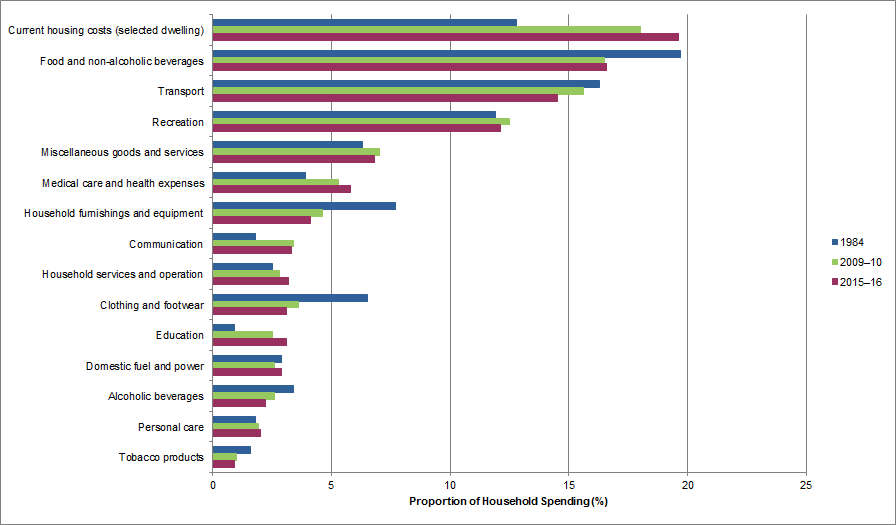
However, how does this compare to household expenditure in previous years? The graph below details the expenditure for each of the categories for the years 1984, 2009-10, and 2015-16.
How to save money | Australians show how and why they’re saving
The detailed infographic below breaks down exactly how and why Australians are saving their money.
We’re here to help
To see how you can start utilising your savings goals, find out more at ASIC’s savings goals calculator. If you require assistance with managing your finances, please do not hesitate to get in touch with us. We would be more than happy to assist you.


