


Beware the Ides of March! The month of March lived up to its brutal reputation that all started on 15 March 44BC when Marcus Brutus stabbed Julius Caesar to death in the Roman Senate. Red ink flowed during March like the blood of Caesar. However, despite the dramatic headlines, markets have merely returned to a normal level of volatility. In fact, 2017 was the unusual year, with its very low volatility. We need to keep some perspective and understand that it is the norm, rather than the exception, to see a 10% correction at some point during any given calendar year. And when you do see that sort of correction, it often makes the 12 month trailing performance look very ordinary, as you can see in the 12 month numbers in our table.
| INDEX RETURNS AS AT 31 March 2018 (%) | ||||
| 1 month | 3 months | 6 months | One year | |
| Australian Shares | -3.77 | -3.86 | 3.48 | 2.54 |
| International Shares | -0.44 | 1.24 | 7.46 | 15.15 |
| Domestic Listed Property | 0.11 | -6.19 | 1.12 | -0.07 |
| Global Listed Property | 2.37 | -5.30 | -1.85 | 1.23 |
| Australian Fixed Interest | 0.84 | 0.87 | 2.32 | 3.28 |
| International Fixed Interest | 0.84 | -0.09 | 0.81 | 2.89 |
| Cash | 0.14 | 0.43 | 0.85 | 1.73 |
| Market Indices | ||||
| S&P/ASX 200 Accumulation Index | ||||
| MSCI World ex Aust TR Index $A | ||||
| S&P/ASX 300 Property Trusts Accum Index | ||||
| FTSE EPRA/NAREIT DEVELOP NR INDEX (A$ HEDGED) | ||||
| Bloomberg Composite 0 + Years | ||||
| BarCap Global Aggregate Index Hedged AUD | ||||
| Bloomberg Aus Bank Bill Index | ||||
Australian shares appeared to be the worst of the asset classes, but in local currency terms most global markets had similar falls. The German DAX index was down 2.73% and down 6.35% over three months. The S&P500 index of the top 500 US companies was down 2.54% for the month. The reason why global shares are showing less of a fall in our table above is due to the currency translation. With the Australian dollar seen as a ‘commodity’ currency, it has a tendency to rise when global growth is going well and fall when investors revert to ‘risk-off’ mode. That creates a natural ‘shock-absorber’ which makes un-hedged global sharemarket exposure a good diversifier to Australian shares.
While we still have a view that global growth will be robust and synchronised this year, meaning equity market declines should be modest, it must be said that this growth is still fragile. The fragility arises from global debt levels, and the desire for central banks to ‘normalise’ their balance sheets that are bloated with government debt. Japanese government debt is monstrous. Even with rates of close to zero, they currently spend 24% of government revenues on debt servicing. The USA, which is well into an economic upswing, is still running deficits, recently expanded by the Trump tax cuts. By 2020 the US will have $25 trillion of debt, and assuming average interest rates of only 2.00% they will spend 25% of government revenue servicing that debt!
We mention this debt load, not with the concern, ‘how are we ever going to pay this off’, because the truth is governments, like corporations, never fully pay off debt. It makes sense for both governments and companies to maintain a certain perpetual level of debt. No, we mention the debt load because of the view that the quantum of government debt will provide a huge incentive for central banks to move with caution to avoid a dramatic increase in bond rates, which in turn impacts on the debt servicing costs of governments as they re-finance existing debt as it matures.
At the same time, consumer debt is also very high, and nowhere more so than here in Australia. One might have thought that after the GFC, households would have gradually reduced overall indebtedness. Not so. The chart below shows how after a pause for the 3 years after 2008, we went right on accumulating ever more debt at an aggregate level.
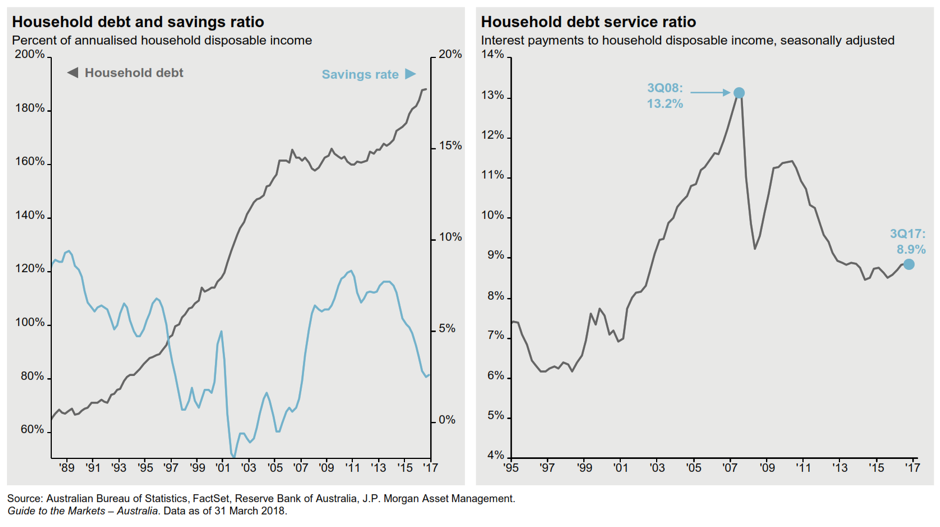
All of that debt growth helped to fuel further property price increases, aided and abetted by ultra low interest rates. This was particularly pronounced in the period 2012 to 2017.
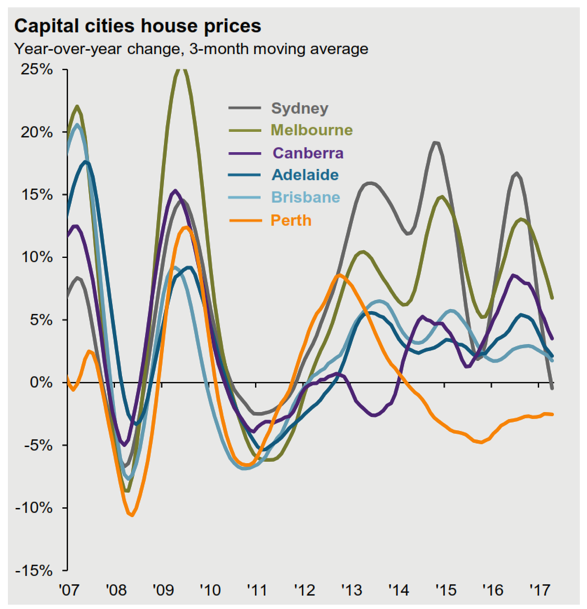
Source: JP Morgan & RPD CoreLogic
Rising property prices has a positive wealth effect on the psyche of humans, and so borrowing more to join the band wagon seemed like the natural thing to do.
Subtly however, the month of March 2018 saw the year on year rate of change for Sydney house prices falling into the negative territory, with rates of change elsewhere also trending lower.
Clearly the debt and property discussion is somewhat off topic from the sharemarket falls that we started this article with, however all markets are subtly interlinked. It isn’t always obvious what the link is, but we naturally look first at the global picture in order to formulate our localised investment preferences.
The biggest of big pictures sits in the global debt and central bank decisions. From there flows interest rate outlooks. At present the unprecedented levels of government debt have us believing that there will be a tendency by central bankers to tolerate slightly higher levels of inflation before pushing rates up dramatically. This in turn indicates that rates overall remain low, and from that we get minimal inflation adjusted returns on debt securities. From that backdrop it is probable that investors keep buying the dips in equity markets this year, as they find the alternatives un-attractive.