

The S&P/ASX 200 Accumulation Index rose another 1.09% in May, helped along by a surging CSL which hit its highest ever price. Materials also assisted, with BHP rising 6%. The rolling one year return for the S&P/ASX 200 Accumulation Index is at 9.63%, only beaten by the MSCI World index at 10.37%.
The Australian Real Estate Investment Trust (A-REIT) sector was a star performer over one and three months, with gains of 2.98% and 7.50% respectively. Fears of a rapid rise in rates were overdone in February and March, and the A-REIT’s have bounced strongly from oversold levels.
| INDEX RETURNS AS AT 31 MAY 2018 (%) | ||||
| 1 month | 3 months | 6 months | One year | |
| Australian Shares | 1.09 | 1.08 | 2.81 | 9.63 |
| International Shares | 0.48 | 2.77 | 2.50 | 10.37 |
| Domestic Listed Property | 2.98 | 7.50 | 0.86 | 5.69 |
| Global Listed Property | 2.23 | 7.66 | 0.61 | 4.81 |
| Australian Fixed Interest | 0.69 | 1.18 | 0.68 | 1.67 |
| International Fixed Interest | 0.33 | 0.05 | -0.99 | 1.10 |
| Cash | 0.17 | 0.48 | 0.91 | 1.78 |
| Market Indices | ||||
| S&P/ASX 200 Accumulation Index | ||||
| MSCI World ex Aust TR Index $A | ||||
| S&P/ASX 300 Property Trusts Accum Index | ||||
| FTSE EPRA/NAREIT DEVELOP NR INDEX (A$ HEDGED) | ||||
| Bloomberg Composite 0 + Years | ||||
| BarCap Global Aggregate Index Hedged AUD | ||||
| Bloomberg Aus Bank Bill Index | ||||
Residential property, an unlisted asset with much longer ‘cycles’ from peak to trough is only just starting its decline in Sydney and Melbourne. Back in November 2017 we wrote about our view that residential property in the Southern capitals had likely peaked.
At that point we had no knowledge of what would unfold with the Hayne Royal Commission into misconduct in the banking and financial services sectors. While it has been beneficial in exposing some predatory practices in both banks and financial planning sectors, it is likely to also go down in history as a factor in the 2018/19 property slump.
While reported declines are a modest 4.2% in Sydney compared to May 2017, there is evidence in some pockets of apartment prices being offered at 15% discounts.
There are six headwinds all blowing against residential property right now.
- High levels of existing indebtedness, at average of 189% private debt to income ratios.
- Regulatory pressure to cap the total percentage of interest only loans.
- Higher transaction and holding costs resulting in less appetite from Chinese investors.
- Wages relative to housing costs in Melbourne and Sydney.
- Closer scrutiny of actual household expenditures when assessing loan applications.
- Upcoming election year where the opposition wants to eliminate negative gearing.
To be fair, we also have to acknowledge the tailwinds.
The main thing that comes to mind here is population growth.
According to Michael Matusik there was a total of 142,713 Australian babies born in 2017, but we know they aren’t buying houses. There were also 245,402 new arrivals to Australia, some of whom might be home buyers. About 98,000 of those migrants came to Sydney and obviously they need somewhere to live. But the sceptic would suggest that the majority won’t be able to stump up the cash for a $1,100,000 home.
What about locals moving up while immigrants backfill into the ‘cheaper’ properties? Again, if you look back to the list of headwinds, it seems that wages and credit conditions are unlikely to provide enough fuel to push already expensive prices higher.
The good news is that immigration and natural population growth is unlikely to lead to a twenty-five-year property crisis like they have had in Japan. If you want to see a really scary movie go visit a regional or rural Japanese town and see what can happen when you have a property bubble that coincides with a general decline in population.
If immigration and population growth continues, then we may see the trend of migration to the more affordable regions, helping prices to remain firm. And with lower starting prices, those property markets may well outperform the larger capitals. With thanks to Michael Matusik, I have included a copy of his property sector clock below.
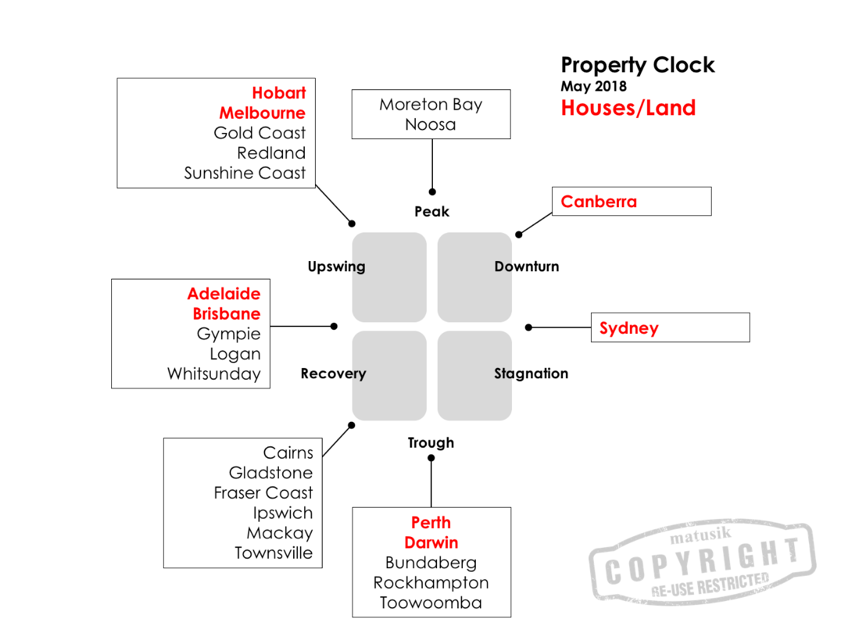
Head to Michael’s site to become a subscriber to one of the most honest property market commentators you will find, and at only $99 a year.
Official cash rates unchanged for the 20th month in a row
Fixed interest. Another month with no change in official cash rates. Some commentators are putting the next rate rise as far away as 2020. Our interest rates are now below US rates for most maturity periods. Although the RBA left official rates on hold, there was a small lift in the Bank Bill Swap Rate during the month. This was off the back of a widening in overseas spreads in the Interbank Overnight rates. Some term deposit rates ticked up by 10 to 15 basis points. Current term deposit rates are around 2.55% for three months, 2.75% for six months, and 2.80% for a year.
A portfolio of investment grade corporate bonds has a running yield of around 3.00% at present. While moving further up the risk spectrum hybrids are yielding a fraction over 5.00% when franking is included.
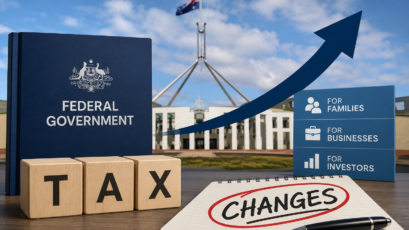
A first: Tax deduction for Personal Super Contributions
To finish up, just a quick reminder here that this is the first year that employees have been able to claim a tax deduction for their personal super contributions. If you want to do some last-minute tax planning, talk to our experienced team at Quill Group.