


Plunging share prices during December saw everyone fretting on ‘the Santa’ rally – December is often a very strong market. Turns out that Christmas eve was the turning point. I don’t believe in Santa, but I do believe that when markets get deeply oversold, they become ripe for a strong bounce. That is what we got in the last four trading days of December, with the S&P500 up by 6.5%.
An un-precedented event in the last ten years
In a note I sent to clients on December 24, I explained that we had just had 9 down days in a row on the S&P 500 index and that was un-precedented in the last ten years. Some other research in that report (where market is down 3 weeks in a row and the final week is -7% or more) showed that the average return in the week after such extreme events, was 5.87%.
Still, even with the rally, the overall S&P500 return for December was -9.07% and the full 2018 calendar year was -4.94%.
The Morgan Stanley Capital Index (MSCI) of global stock markets in local currencies was -7.69%, though when translated into Australian dollars was a small gain of 1.25% as shown in our table. The Australian dollar decline in 2018 was -9.73% vs the USD, and -5.52% vs the Euro.
| INDEX RETURNS AS AT 31 December 2018 (%) | ||||
| 1 month | 3 months | 6 months | One year | |
| Australian Shares | -0.12 | -8.24 | -6.83 | -2.84 |
| International Shares | -3.62 | -10.29 | -4.25 | 1.25 |
| Domestic Listed Property | 1.73 | -1.71 | 0.24 | 3.27 |
| Global Listed Property | -6.03 | -5.76 | -5.48 | -3.95 |
| Australian Fixed Interest | 1.50 | 2.24 | 2.80 | 4.54 |
| International Fixed Int | 1.43 | 1.66 | 1.59 | 1.65 |
| Cash | 0.15 | 0.48 | 0.99 | 1.92 |
| Market Indices | ||||
| S&P/ASX 200 Accumulation Index | ||||
| MSCI World ex Aust TR Index $A | ||||
| S&P/ASX 300 Property Trusts Accum Index | ||||
| FTSE EPRA/NAREIT DEVELOP NR INDEX (A$ HEDGED) | ||||
| Bloomberg Composite 0 + Years | ||||
| BarCap Global Aggregate Index Hedged AUD | ||||
| Bloomberg Aus Bank Bill Index | ||||
Before we go into the 2019 outlook, it is worthwhile recounting what we said at the start of 2018 (January). “While not suggesting any imminent crash, it is important to understand that outsized gains in widely held asset classes are normally followed by lower than average gains in future”.
Well, 2018 gave us the lower than expected gains, interspersed with two sharp downturns, that are somewhat masked when you only look at the rolling one-year return column.
Outlook for 2019
I have often quoted the Danish proverb, “It is difficult to make predictions, especially about the future”. Yet, each year, we want to rebase our expectations and plan ahead, as if we will somehow be defined by the calendar year. So rather than some kind of arbitrary points-based targets for the various indexes, we consider what is fair value, what is cheap; and what can go well and what could go wrong.
The near 20% decline in the S&P 500 has brought shares back to around fair value on a Price to Earnings (P/E) basis. The big risk is that analysts are too optimistic about earnings, which have so far been pumped up by tax cuts, low interest rates, and a declining rate of un-employment. Earnings can be cut dramatically in a recession.
In Australia the last four brutal months of 2018 has also brought the Australian share market down to a forward P/E ratio of 14.2 which is right in line with the 18 year average. The dividend yield is now 5.1% which is above the 18 year average of 4.6%.
Trouble is, the cheap earnings are in Financials, which are 32% of the ASX200 and have a P/E ratio of 11.7X. The next biggest sector is Materials, where the P/E ratio is 12.8. Stepping outside of those two sectors, which make up 50% of the market, the Industrials are still priced at 20.5 times earnings. Consumer staples are priced at 19.7 times earnings. So while the market looks better value at these levels, one has to be somewhat cautious about the future earnings of banks with the events in property markets in the last year.
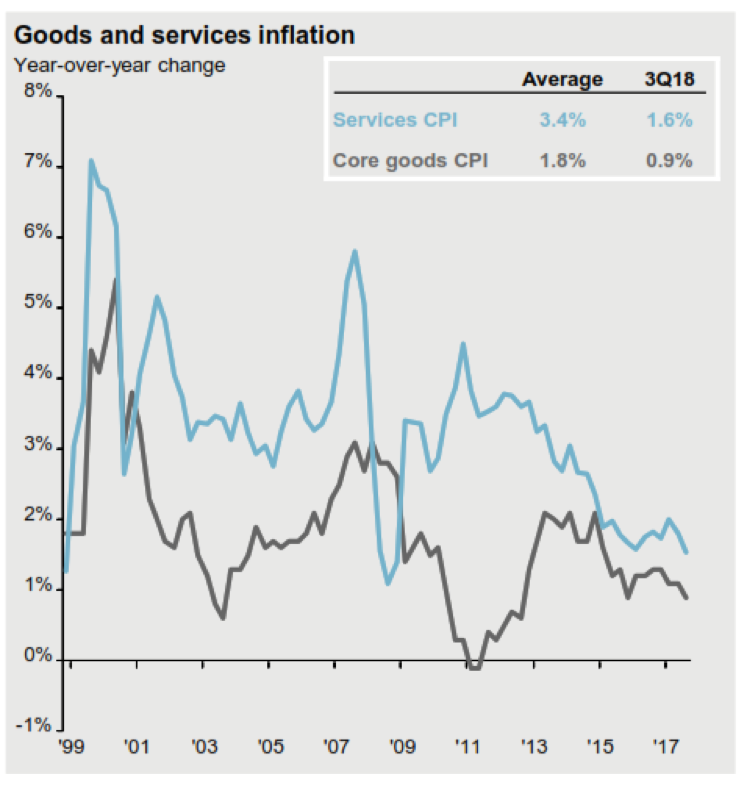
One thing is clear. We have gone from a regime of Inflation and Growth accelerating, (as was the case through 2017), into a phase where the rate of change in both Growth and Inflation are decelerating.
The chart below from JP Morgan illustrated how that is the case in Australia, and this is also true for the USA.
The bond market is telling us that this is not just a monthly blip in the numbers, but rather a general weakening in the economy. After grinding higher with a few pull-backs during the year, the ten year bond yield in America peaked at 3.23% in October, and fell to 2.68% by the end of the year.
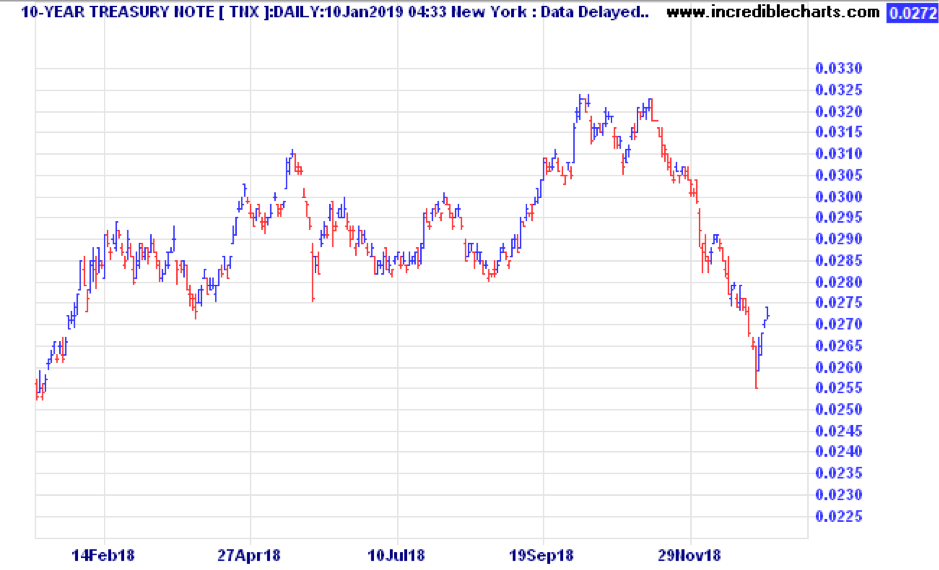
The ten-year bond yield is important, as almost all analytical models rely on the expected risk free rate of return (the government bond yield) as a key input to valuing the future cashflows from assets, be they shares, property, or infrastructure assets.
Last year resulted in poor returns for Infrastructure because of the fear of rising rates. We believe that Infrastructure is an asset to consider in 2019, as a reliable source of cashflow, not tied to banking or discretionary spending.
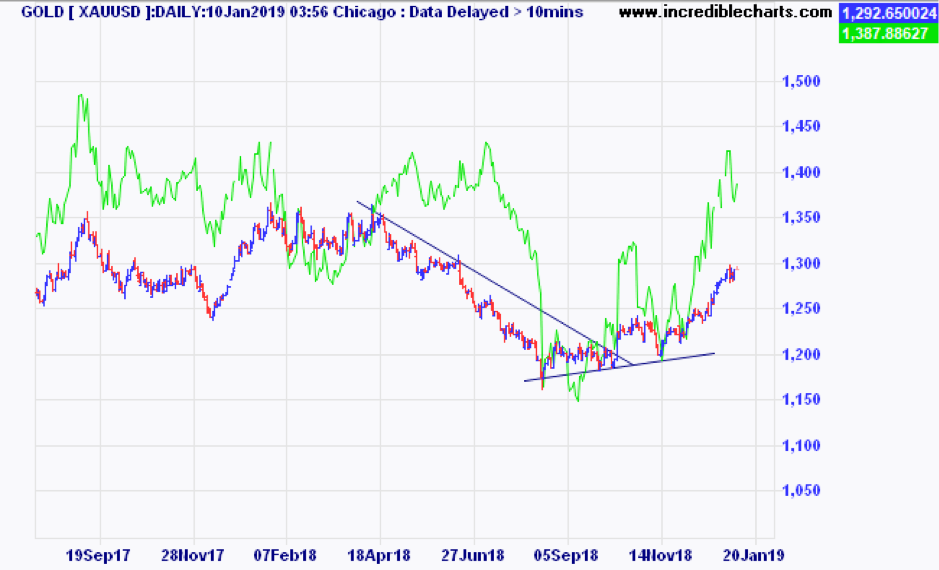
Gold may also do well if political uncertainty continues. Gold was in a downtrend for most of 2018, because a rising USD (happening due to rising interest rates) is the most often the natural enemy of gold. But on 16 August, gold bottomed out, and started its current rise. In the chart below we have interposed the global gold miners index ETF (GDX.ASX) over the gold price, and you can see the crescendo of selling that climaxed on 16 August in both physical gold and the gold mining companies and has perked up and is nicely rising while other assets are falling. Russia added at least 264 tonnes of gold to its central bank coffers during 2018 and other CB’s are doing the same.
The only thing working against gold is the possibility of a stronger US dollar. With Europe and Japan still sitting on the lowest interest rates in a lifetime, the short term rates on offer in the US dollar is still relatively attractive and this may keep the currency stronger.
Emerging markets also have a chance of surprising in 2019. It may not be a popular pick as those markets have also sold off because of the rising USD. They are also victims of the Trump trade disputes, and a number of countries and companies have binged on cheap loans. But within those markets are many sound companies and savvy investors are already bargain hunting select stocks within India, China, Taiwan, Korea and Indonesia.
What is not likely to improve in 2019 is residential property in Australia. The property cycle peaked in mid 2017, and so has been in decline ever since. Some are saying that 2019 might be a good time to buy, however the length of this downswing is likely to be extended due to a number of factors. First, Sydney and Melbourne prices relative to incomes were way above historical averages. Second, the fall so far has been obvious enough that it has changed the mentality of buyers. While the herd mentality on the way up was “FOMO” (fear of missing out), that has now turned to “I can afford to wait”. Third, the credit environment has changed dramatically. The Royal Commission has swung the bankers pendulum to the opposite side, where they are now afraid to write a loan without calculating every single expense, including your Foxtel subscriptions. The fourth factor is that the cash rich, price insensitive Chinese buyers have all but disappeared, thanks to a corruption crackdown, capital restrictions, and changes to stamp duty and land tax for foreign owners.
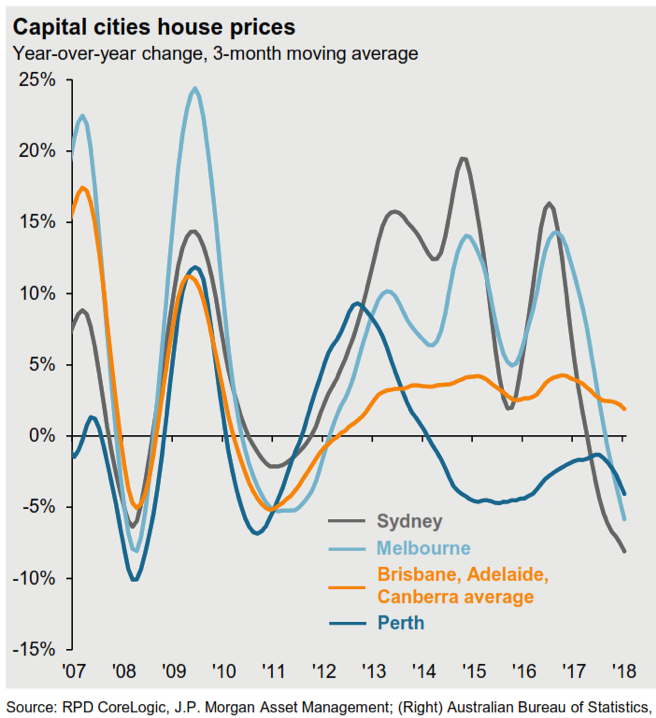
My view is that we don’t see a bottom in the Sydney and Melbourne markets until 2020 or 2021. Buying at ‘mortgagee in possession’ sales is likely to produce the best bargains.
Conclusions
If this is a normal year, then stocks could do well after the repricing during the September – December sell-off. (We are off to a good start in January) The risk is that companies start to downgrade earnings, (like Apple did recently) and then they don’t look so cheap. Sentiment can turn quickly. Sticking with a well diversified, quality portfolio will pay off in the long run, in spite of short term volatility.
If you want to get more involved with your superannuation, investments or insurance, please give us a call at Quill Group.